
Gold Mid-Tiers’ Q3’26 Fundamentals
Adam Hamilton November 20, 2026 3414 Words
Smaller mid-tier and junior gold miners just finished reporting another great quarter, earning some of their fattest profits ever. That was no mean feat, as smaller gold miners had to overcome Q3’s big gold swings and surging mining costs. Like usual mid-tiers well-outperformed the majors. Yet smaller gold stocks are now trading at record-low valuations, hammered by gold’s recent Fed-rate-hike-fear-driven breakdowns.
The leading mid-tier-gold-stock benchmark is the GDXJ VanEck Junior Gold Miners ETF. With $6.6b in net assets midweek, it remains the second-largest gold-stock ETF after its big-brother GDX. That’s dominated by far-larger major gold miners, though there is much overlap between these ETFs’ holdings. Still misleadingly named, GDXJ is overwhelmingly a mid-tier gold-stock ETF with juniors having lesser weightings.
Gold-stock tiers are defined by miners’ annual production rates in ounces of gold. Small juniors have little sub-300k outputs, medium mid-tiers run 300k to 1,000k, large majors yield over 1,000k, and huge super-majors operate at vast scales exceeding 2,000k. Translated into quarterly terms, these thresholds shake out under 75k, 75k to 250k, 250k+, and 500k+. Today only six of GDXJ’s 25 biggest holdings are true juniors.
Their Q3 outputs are highlighted in blue in this essay’s table. Juniors not only mine less than 75k ounces per quarter, but gold output generates over half their quarterly revenues. That excludes streaming and royalty companies that purchase future gold output for big upfront payments helping finance mine-builds, and primary silver miners producing byproduct gold. But mid-tiers often make better investments than juniors.
These gold miners dominating GDXJ offer a unique mix of sizable diversified production, excellent output-growth potential, and smaller market capitalizations ideal for outsized gains. Mid-tiers are less risky than juniors, while amplifying gold uplegs more than majors. So we’ve long specialized in the fundamentally-superior mid-tiers and juniors at Zeal, actively trading these smaller gold miners for over a quarter-century now.
Technically GDXJ fared well in Q3 proper, rallying 16.0% to amplify gold’s 3.4% gains by 4.8x. That was strong outperformance, as typically smaller gold miners tend to leverage their metal by 3x to 4x+. Those quarterly gains didn’t accrue gradually though, as gold saw opposing big swings within Q3. In mid-July, gold’s necessary and healthy serious reckoning finally bottomed after its late monster record cyclical bull.
Then gold soon blasted higher in a huge August, fueled by a major upside breakout from a massive bullish falling-wedge chart pattern and the US Treasury upping its longer-bond buybacks. By late August gold had soared 17.4% in under six weeks, which GDXJ amplified 2.8x with a big-and-fast 48.3% rally! But those promising young uplegs were scuttled in late August by heavy gold selling on Fed-rate-hike fears.
First in late August Trump’s Fed chairman talked a big hawkish game on fighting inflation at this central bank’s annual Jackson Hole symposium. Then in mid-September this Warsh Fed executed its first hike in 3.1 years at 25 basis points. Next in early November a Fed governor started pushing for a 50bp hike at the FOMC’s next meeting in early December. All that spawned gold-futures selling, hitting the metal and miners.
By quarter-end gold and GDXJ had retreated 11.0% and 16.1% from their late-August interim highs, prior to this recent mini-mania in Fed-rate-hike expectations. At 1.5x downside leverage, smaller gold stocks proved quite resilient. But more bouts of rate-hike-fear-driven selling in recent weeks slammed gold and GDXJ’s total losses since late August to 20.1% and 33.7% as of midweek, still making for a modest 1.7x.
That vexing 2.8-month-old drubbing has left mid-tier and junior gold stocks deeply out of favor, mired in universal bearishness and apathy. But the best times to buy relatively low are episodes like these when few others are willing. The usual post-earnings-season fundamental analyses must go on, despite the lack of interest always accompanying deeply-oversold technicals. The smaller gold miners continue to thrive.
For 42 quarters in a row now, I’ve painstakingly analyzed the latest operational and financial results from GDXJ’s 25-largest component stocks. Mostly mid-tiers, they now account for 63.2% of this ETF’s total weighting. While digging through quarterlies is a ton of work, understanding smaller gold miners’ latest fundamentals really cuts through the obscuring sentiment fogs shrouding this sector. This research is essential.
This table summarizes the GDXJ top 25’s operational and financial highlights during Q3’26. These gold miners’ stock symbols aren’t all US listings, and are preceded by their rankings changes within GDXJ over this past year. The shuffling in their ETF weightings reflects shifting market caps, which reveal both outperformers and underperformers since Q3’25. Those symbols are followed by their current GDXJ weightings.
Next comes these gold miners’ Q3’26 production in ounces, along with their year-over-year changes from the comparable Q3’25. Output is the lifeblood of this industry, with investors generally prizing production growth above everything else. After are the costs of wresting that gold from the bowels of the earth in per-ounce terms, both cash costs and all-in sustaining costs. The latter help illuminate miners’ profitability.
That’s followed by a bunch of hard accounting data reported to securities regulators, quarterly revenues, earnings, operating cash flows, and resulting cash treasuries. Blank data fields mean companies hadn’t disclosed that particular data as of the middle of this week. The annual changes aren’t included if they would be misleading, like comparing negative numbers or data shifting from positive to negative or vice-versa.
Gold miners’ operational performances depend on prevailing gold prices, production growth, and cost control. Mid-tiers and juniors fared pretty well in Q3 on these fronts, leading to great results. Yet today’s battered stock prices certainly aren’t reflecting those, with irrational bearish sentiment dragging technicals far under reasonable levels. This huge technical-fundamental disconnect is a big opportunity for contrarians.
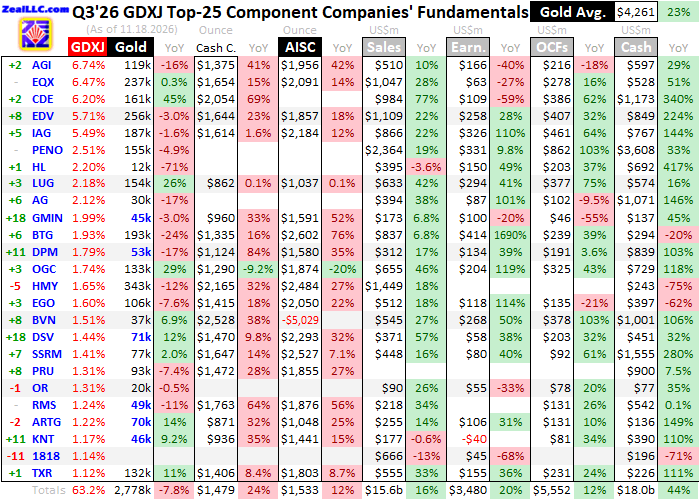
Unlike its big-brother GDX, GDXJ’s top holdings are much more dynamic. Mid-tiers and juniors with new mines or major expansions going live can fly into its upper ranks on soaring market capitalizations, crowding stagnating ones out. There’s also big overlap between GDXJ and GDX top holdings. GDXJ’s 11 largest components are also all GDX-top-25 ones, and the entire GDXJ-top-25 lineup is also included in GDX!
Again accounting for 63.2% of GDXJ’s weighting, they also represent 25.1% of GDX’s. GDXJ essentially lops off GDX’s 11 largest components which are super-majors and majors, then expands the weighting of the next biggest from a bit over 1/4th to roughly 2/3rds. Occasionally these dominant gold-stock ETFs’ common manager removes a larger miner from GDXJ to be exclusively included in GDX, like in this past year.
For three
quarters in a row into Q4’25, Pan American Silver was GDXJ’s largest holding.
Despite mining 6,070k ounces of silver in Q3’26, PAAS remains a primary gold
miner. Its 168k ounces of gold produced last quarter drove over 7/10ths of its
revenues! PAAS is now GDX’s 10th-largest component. And PAAS being included in
GDXJ-top-25 results in Q3’25 but not Q3’26 definitely skews some year-over-year
comparisons.
These elite mid-tiers’ and juniors’ collective gold production weighed in at 2,778k ounces last quarter, sliding 7.8% YoY. That was better than the GDX top 25’s falling 8.6% YoY to 7,253k, but way behind world gold-mining output. The World Gold Council publishes gold’s best-available global supply-and-demand data once a quarter in its fantastic Gold Demand Trends reports, which are must-reads for gold-stock traders.
Last quarter’s global gold production grew an impressive 2.9% YoY to 34,430k ounces! This made for the best Q3 output on record according to the WGC. It’s unfortunate the GDXJ-top-25 miners didn’t track closer, but this was skewed low. Excluding PAAS from Q3’25 output while adding in GDXJ’s then-26th-largest component’s improves this to -5.8% YoY. B2Gold also suffered a big 24.1% YoY or 61k-ounce drop.
That was planned, driven by one of its mines finishing its open-pit phase while another largely spent 2026 stripping lower-grade ores. Primary silver miner Hecla also saw its gold output plummet 70.5% YoY or by 29k ounces. Earlier this year HL decided to sell its lone primary gold mine to refocus on silver mining. So elite smaller gold miners’ production decline in Q3 is considerably more modest than the GDXJ top 25’s implies.
Despite GDXJ’s ongoing composition changes led by larger miners periodically graduating into GDX exclusivity, smaller gold miners are still outperforming. Relative to the GDXJ top 25’s overall production through the last 42 quarters of this research, Q3’s was 35% up in. That is far better than the GDX top 25’s last quarter just 19% up in. With a whopping 155 components, GDXJ also has a lower proportion in its upper ranks.
Mid-tiers have always been superior to the majors. Running smaller stables of typically one-to-four gold mines, any sizable expansions or new mine-builds really move the needle to grow mid-tiers’ production. They not only usually overcome depletion unlike their larger peers, but often achieve sizable output growth as a group. Smaller gold stocks enjoy outsized gains around new expansions and mines coming online.
Production growth is essential in gold mining because it provides the cashflows necessary to continue expanding existing mines and building or buying new ones, ultimately driving stock prices higher. And surprisingly mid-tiers often have lower mining costs than majors, despite the latter’s supposed economies of scale. That makes mid-tiers much more profitable relative to their production, supporting bigger stock gains.
Also contributing to those is mid-tiers’ lower market capitalizations. The GDXJ top 25’s averaged merely $8.6b this week, around 1/4th of the GDX top 25’s $33.0b average last week! Generally the smaller any company’s market cap, the less inertia its stock price has and the less capital inflows needed to drive it higher. So when gold is powering higher fueling sector interest, mid-tiers and juniors really outperform.
As usual in this long research thread, immediately after earnings season I started with the GDX top 25’s Q3’26 results which I analyzed in depth in last week’s essay. Comparing the mid-tier-dominated GDXJ’s quarterlies with the major-dominated GDX’s helps explain smaller gold miners’ outperformance which is also evident in stock prices. GDXJ again tends to amplify major gold moves 3x to 4x+, besting GDX’s 2x to 3x.
Unit gold-mining costs are generally inversely proportional to gold-production levels. That’s because gold mines’ total operating costs are largely fixed during pre-construction planning stages, when designed throughputs are determined for plants processing gold-bearing ores. Their nameplate capacities don’t change quarter-to-quarter, requiring similar levels of infrastructure, equipment, and employees to keep running.
So excluding rarer mine expansions, existing mines have fixed tonnages of ores they can process each quarter. That makes ore grades fed into their plants the primary variable driving gold production, and those vary widely even within individual gold deposits. Richer ores yield more ounces to spread mining’s big fixed expenses across, lowering unit costs and boosting profitability. And over time mines’ ore grades decline.
Cash costs are the classic measure of gold-mining costs, including all cash expenses necessary to mine each ounce of gold. But they are misleading as a true cost measure, excluding the big capital needed to explore for gold deposits and build mines. So cash costs are best viewed as survivability acid-test levels for smaller gold miners. They illuminate the minimum gold prices necessary to keep the mines running.
Last quarter the GDXJ top 25’s average cash costs soared 23.9% YoY to a record $1,479 per ounce! In past years occasional similar cash-cost jumps were seen, but they only lasted one quarter. 2026’s first three have witnessed GDXJ-top-25 cash costs soar 25.9%, 24.8%, and that 23.9% YoY! The global inflation unleashed by Trump’s war with Iran has driven up global mining costs considerably, led by diesel.
All the heavy equipment necessary to mine gold including giant excavators and massive haul trucks runs on diesel. Plenty of the GDXJ top 25 mentioned diesel prices as a key driver for their higher mining costs last quarter. Artemis Gold for example narrowed its 2026 cost guidance to “the very top end” of its range because of “general inflationary pressures, including higher diesel prices”. Diesel has utterly soared this year.
Even in the US in Q3, national-average retail diesel prices skyrocketed 48.1% YoY to $5.56 per gallon! And realize the US runs a huge diesel-production surplus and remains the world’s largest exporter of that essential industry fuel. Many of the world’s gold mines are in remote areas in less-developed countries where sourcing adequate diesel is more expensive and challenging. Mining is getting costlier globally.
All-in sustaining costs are far superior than cash costs, and were introduced by the World Gold Council in June 2013. They add on to cash costs everything else that is necessary to maintain and replenish gold-mining operations at current output tempos. AISCs give a much-better understanding of what it really costs to maintain gold mines as ongoing concerns, and reveal smaller gold miners’ true operating profitability.
The GDXJ top 25’s average AISCs last quarter climbed 11.9% YoY to a record $1,533 per ounce. Cash costs are the lion’s share of AISCs, so whatever drives the former heavily affects the latter. Yet despite these rising mining costs, the GDXJ top 25 still trounced the GDX top 25. The majors dominating GDX saw average AISCs soar 22.0% YoY in Q3 to a far-higher $1,883 per ounce! But that’s not a clean comparison.
One of the GDXJ-top-25 components in both Q3’26 and Q3’25 was Peru’s Buenaventura, which has long reported the impossible. Last quarter it declared gold all-in sustaining costs of -$5,029 per ounce! How is such sorcery even feasible? BVN is an unusual non-primary-gold miner still choosing to report in gold-centric terms, likely because gold stocks draw much more investor interest and capital than base-metals ones.
In Q3’26 Buenaventura’s gold output accounted for just 29% of its revenues, yet this polymetallic miner still inexplicably chooses to credit its collectively-much-larger silver, copper, zinc, and lead production as gold byproducts gutting its AISCs. Last quarter one of its mines yielded 13.5k metric tons of copper, 390k ounces of silver, and negligible gold. Yet that mine still reported ludicrous gold AISCs of -$42,764 per ounce!
Interestingly the jig is finally up on this nonsensical AISC reporting, maybe partially thanks to my years of gold-miner-results essays illuminating it. Topping BVN’s Q3’26 report’s AISC section, a boldfaced new line was added declaring “Beginning 4Q26, the Company will report All-in Sustaining Cost (AISC) by mine, expressed per unit of each mine’s primary metal”. That’s the way it always should’ve been done of course.
This implies the years of Buenaventura’s crazy-negative AISCs dragging down the averages are over, which is good news. But for the entire 42-quarter history of this research thread, I’ve always included all reported data no matter how distorted some was. Nearly all outlying AISCs have proven anomalous high-side ones, dragging up GDXJ-top-25 averages. So for consistency’s stake I have to include BVN’s low outliers.
But to illustrate BVN’s distorting skew, excluding its negative AISCs in both Q3’26 and Q3’25 leaves the GDXJ top 25’s average AISCs surging 22.7% YoY to $1,897 per ounce. Both are right in line with the GDX top 25’s $1,883 up 22.0% YoY. BVN has also made the GDX-top-25 ranks in past years, but not in either of these relevant quarters. It ranked as 30th last week, and I sure hope its AISC-skewing days are over.
Rather than worrying about absolute AISC changes, more relevant is their ratio relative to prevailing gold prices. In Q3’26 the GDXJ top 25’s $1,533 BVN-skewed average merely ran 36.0%, which was the fourth best ever after the preceding three quarters! For comparison in the five years before Q4’23 birthed that late record gold bull, that AISC-to-gold ratio averaged a far-higher 68%. Smaller gold miners are doing fine.
After my quarter-century-plus of intensely studying this sector, I’ve found the best metric for measuring gold miners’ collective fundamental performance is their implied unit earnings. That simply subtracts the GDXJ-top-25 average AISCs from the quarterly-average gold price. This is way cleaner than bottom-line accounting profits, since a varying GDXJ-top-25 subset’s are usually distorted by big noncash charges or gains.
Gold’s $4,261 average last quarter proved its third-highest ever, surging 23.2% YoY. That less those GDXJ-top-25 average AISCs of $1,533 yields fat implied sector unit profits of $2,729 per ounce! Those are the smaller gold miners’ third best ever, and surged an impressive 30.6% YoY despite last quarter’s struggles! And this wasn’t one-off earnings growth, but the latest in a long parade of quarterly windfall profits.
Astoundingly over the last 13 consecutive quarters ending Q3’26, the GDXJ-top-25 implied unit earnings have skyrocketed 106%, 133%, 63%, 63%, 71%, 95%, 91%, 79%, 82%, 102%, 131%, 68%, and that 31% YoY! There can’t be any other sector in all the stock markets even remotely competing with such massive consistent profits growth, it is phenomenal. But this long streak is likely to give up its ghost in Q4.
Because of gold’s irrational Fed-rate-hike-fear-driven breakdowns so far in Q4, it is now averaging $4,049 quarter-to-date. These are still great gold levels, the fifth-highest quarter ever at this point. Yet that still would be down 2.5% YoY. If quarterly-average gold prices indeed finish Q4 slumping, it will be their first negative quarter since Q4’22! Gold miners will still earn hefty profits, but their earnings-growth streak will end.
That’s not a problem given smaller gold miners’ record-low valuations, so let’s head there through their hard accounting results reported to securities regulators in Q3 under GAAP or other countries’ equivalents. Even losing PAAS, the GDXJ top 25’s total revenues surged 16.1% YoY to $15,562m which was their third highest ever. Those fueled bottom-line earnings jumping 20.0% YoY to $3,480m, their fourth highest.
Such strong earnings combined with recently-battered gold-stock prices have pounded the GDXJ-top-25 average trailing-twelve-month price-to-earnings ratios back down to 14.7x! That’s the lowest they’ve ever been, deeply undervalued. For reference in Q4’23 when gold’s late monster record bull was born, that ran 45.0x. Quarterly-average GDXJ levels more than tripled across this span, yet valuations still crashed by 2/3rds!
If you’re contrarian-enough to want to buy fundamentally-superior smaller gold stocks low, they’ve never been cheaper relative to their underlying earnings! And they are super-oversold too after recent weeks’ pummeling. Midweek GDXJ closed at just 77.5% of its baseline 200-day moving average, which is the most-oversold smaller gold miners have been in fully 4.0 years! This sector is a screaming bargain today.
The GDXJ top 25’s operating cash flows climbed 12.0% YoY in Q3 to $5,552m, their fourth highest ever. That helped catapult their collective cash treasuries up 43.9% YoY to $17,970m, narrowly achieving a new all-time record! The smaller gold miners have prudently accrued vast cash warchests to fund future production growth, through expanding existing mines and building new ones. Their fundamentals are great.
We’re constantly looking for the ever-changing highest-production-growth subset of mid-tiers and juniors with big new expansions or mine-builds soon coming online. Those provide catalysts to attract in capital, particularly from fund managers. Sooner or later some critical mass of professional investors is going to increasingly recognize the extreme value in this small sector, and flood in catapulting stock prices way higher.
Successful trading demands always staying informed on markets, to understand opportunities as they arise. We can help! For decades we’ve published popular weekly and monthly newsletters focused on contrarian speculation and investment. They draw on my vast experience, knowledge, wisdom, and ongoing research to explain what’s going on in the markets, why, and how to trade them with specific stocks.
Our holistic integrated contrarian approach has proven very successful, and you can reap the benefits for only $12 an issue. We extensively research gold and silver miners to find cheap fundamentally-superior mid-tiers and juniors with outsized upside potential. Sign up for free e-mail notifications when we publish new content. Even better, subscribe today to our acclaimed newsletters and start growing smarter and richer!
The bottom line is smaller gold miners just reported one of their best quarters ever. That’s despite surging inflation fueled by Trump’s war catapulting mining costs higher. Mid-tiers’ and juniors’ remarkable streak of enormous profits growth extended to 13 consecutive quarters, though it will probably end in this current Q4. Yet even with ongoing cost pressures and gold’s recent breakdowns, gold-mining profits will remain hefty.
Between years of windfall profits and recently-battered stock prices, smaller gold miners’ valuations have fallen to record lows. Gold stocks have never been cheaper relative to their own underlying corporate earnings. That combined with extreme oversoldness makes this a great buying opportunity for contrarian speculators and investors. Gold-stock prices need to mean-revert way higher to reflect their great fundamentals.
Adam Hamilton, CPA November 20, 2026 Subscribe at www.zealllc.com/subscribe.htm
