![]()
Gold Summer Doldrums 4
Adam Hamilton July 2, 2021 3358 Words
Gold, silver, and their miners’ stocks suffer their weakest seasonals of the year in early summers. With traders’ attention normally diverted to vacations and summer fun, interest in and demand for precious metals usually wane. Without outsized investment demand, gold tends to drift sideways dragging silver and miners’ stocks with it. Long feared as the summer doldrums, they’ve really moderated in recent years.
This doldrums term is very apt for gold’s traditional summer predicament. It describes a zone surrounding the equator in the world’s oceans. There hot air is constantly rising, spawning long-lived low-pressure areas. They are often calm, with little prevailing winds. History is full of accounts of sailing ships getting trapped in this zone for days or weeks, unable to make headway. The doldrums were murder on ships’ morale.
Crews had no idea when the winds would pick up again, while they continued burning through their limited stores of food and drink. Without moving air, the stifling heat and humidity were suffocating on these ships long before air conditioning. Misery and boredom were extreme, leading to fights breaking out and occasional mutinies. Being trapped in the doldrums was viewed with dread, it was a very trying experience.
Gold investors can somewhat relate. Like clockwork trudging through early summers, gold starts drifting listlessly sideways. It often can’t make significant progress no matter what trends looked like heading into June, July, and August. As the days and weeks slowly pass, sentiment deteriorates markedly. Patience is gradually exhausted, supplanted with deep frustration. Plenty of traders capitulate, abandoning ship.
June and early July in particular have often proven desolate sentiment wastelands for precious metals, devoid of recurring seasonal demand surges. Unlike most of the rest of the year, the summer months simply lack any major income-cycle or cultural drivers of outsized gold investment demand. Yet three recent summers have been big exceptions to these decades-old seasonals, and 2021’s could still prove another.
Quantifying gold’s summer seasonal tendencies during bull markets requires all relevant years’ price action to be recast in perfectly-comparable percentage terms. That is accomplished by individually indexing each calendar year’s gold price to its last close before market summers, which is May’s final trading day. That is set at 100, then all gold-price action each summer is recalculated off that common indexed baseline.
So gold trading at an indexed level of 105 simply means it has rallied 5% from May’s final close, while 95 shows it is down 5%. This methodology renders all bull-market-year gold summers in like terms. That’s necessary since gold’s price range has been so vast, from $257 in April 2001 to $2,062 in August 2020. That span encompassed two secular gold bulls, the first soaring 638.2% over 10.4 years into August 2011!
While that previous mighty bull ran from 2001 to 2011, 2012 was technically a bull year too since a 20%+ drop back into formal bear territory wasn’t yet seen. That came in Q2’13, where gold plummeted 22.8% in its worst quarterly performance in 93 years! The Fed’s unprecedented open-ended QE3 campaign was ramping to full-speed, levitating stock markets which slaughtered demand for alternative investments led by gold.
The resulting gold-bear years ran from 2013 to 2015, which need to be excluded since gold behaves very differently in bull and bear markets. That ultimately pounded gold to a 6.1-year secular low in December 2015, which helped birth today’s gold bull. It has gradually powered higher on balance ever since, never suffering any bull-slaying 20%+ selloffs. So 2016 to 2021 have proven gold-bull years to add into this analysis.
When all gold’s summer price action from these modern gold-bull years is individually indexed and thrown into a single chart, this spilled-spaghetti mess is the result. 2001 to 2012 and 2016 to 2019 are rendered in yellow. Last summer’s action is shown in light blue for easier comparison with this summer. Seeing all this perfectly-comparable indexed summer price action at once reveals gold’s center-mass-drift tendency.
These summer seasonals are further refined by averaging together all 17 of these gold-bull years into the red line. Finally gold’s summer-to-date action this year is superimposed over everything else in dark blue, showing how gold is performing compared to its seasonal mean. While gold began the summer of 2021 meandering in line with seasonals, the hawkish-Fed-surprise-driven gold-futures purge utterly thrashed it!
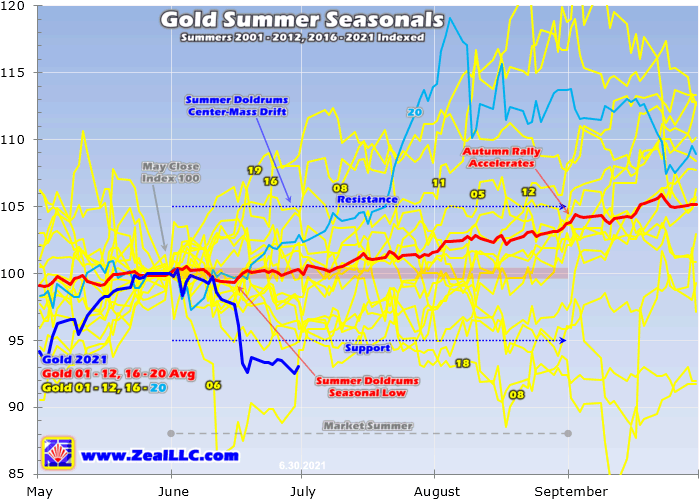
While there are outlier years, gold generally drifts listlessly in the summer doldrums much like a sailing ship trapped near the equator. The center-mass-drift trend is crystal-clear in this chart. The vast majority of the time in June, July, and August, gold simply meanders between +/-5% from May’s final close. This year that equated to a probable summer range between $1,808 to $1,998. Gold tends to remain within trend.
But interestingly “gold summer doldrums” is increasingly a misnomer as more gold-bull years slowly reshape the seasonal average. Gold’s summer seasonal low statistically has been gradually pulled all the way forward to mid-June. On June’s 11th trading day, which translated to June 15th this summer, gold has tended to carve its seasonal low. The worst of gold’s weak seasonals pass quickly in early summers!
At that mid-June nadir, gold has only been down an average of 0.7% from May’s close. From there this metal actually tends to start climbing again into July and especially August. In average indexed terms, gold has tended to eke out 0.3% gains in Junes. They’re the real doldrums. Gold’s momentum starts building to 1.3% gains in Julies, then really accelerates into summer-ends with hefty 2.2% gains in Augusts!
Between that mid-June seasonal low to the end of August, gold has averaged impressive 4.4% summer rallies in all these modern bull-market years! The summer doldrums have been compressed into a shorter time frame by several outlier years in today’s secular gold bull. They were its maiden 2016 summer, summer 2019, and last summer. Different catalysts each summer fueled outsized investment demand.
Comprehensive global gold fundamental supply-and-demand data including investment is only published quarterly by the World Gold Council. And that investment category has been increasingly dominated by gold-exchange-traded-fund capital flows over the past decade or so. Gold ETFs have eclipsed traditional gold investment since they are so cheap and easy to trade. They report their gold-bullion holdings daily.
So these holdings are a high-resolution proxy for global gold investment, the driving force reshaping the summer doldrums. The leading and dominant gold ETFs are the American GLD SPDR Gold Shares and IAU iShares Gold Trust. Per the latest Q1’21 WGC data, at quarter-end GLD and IAU commanded 29% and 14% of all the physical gold held by all the world’s gold ETFs! Third place was way smaller near 6%.
Climbing GLD+IAU holdings reveal American stock-market capital flowing into gold, which has often been the largest share of overall world investment demand. In order to track the gold price, gold ETFs have to shunt excess ETF-share supply and demand directly into gold itself to equalize flow differentials. This is done by issuing and redeeming baskets of ETF shares, with the resulting capital used to buy and sell gold.
Gold’s summer doldrums are moderating and compressing because American stock investors flooded into gold via GLD and IAU shares in 2016, 2019, and 2020. These counter-seasonal investment-demand spikes were all gold-price-driven. Gold was surging higher in bull uplegs, which fueled mounting bullish sentiment. Traders love chasing winners, so they piled into gold-ETF shares accelerating gold’s gains.
Outsized gold investment demand flared in the summer of 2016, when this gold bull’s maiden upleg was maturing. Traders’ greed soared after gold blasted higher for a half-year, slaying a secular bear. So they flooded into gold-ETF shares fast enough to drive gold 12.3% higher between the end of May to early July. GLD+IAU holdings soared 12.1% or 129.1 metric tons in that span, revealing big capital inflows into gold.
That left gold extremely overbought so that initial upleg gave up its ghost, but gold still ended summer 2016 7.7% higher. Gold bucked the summer-doldrums-drift trend that year because investment demand led by American stock traders was strong! With GLD and IAU shares being bought faster than gold, their managers issued enough new shares to absorb that differential demand then used the proceeds to buy gold.
A similar gold-momentum-chasing dynamic unfolded in the summer of 2019, when another major gold upleg was maturing. Stock traders rushed to ride gold’s big gains, through heavy differential buying of GLD and IAU shares. Between the end of May to early September that year, gold rocketed up 19.0%! That sharp rally was fueled by massive capital inflows into gold, with GLD+IAU holdings soaring 19.0% or 194.8t!
During that full market summer from the ends of May to August 2019, gold’s huge counter-seasonal gains clocked in at 16.7%. As long as gold is relatively-high and has been rallying on balance long enough to fuel greedy sentiment, American stock investors will increasingly flood in to chase those gains. That’s regardless of where the calendar happens to be. So strong gold prices unleash summer investment demand.
Last year in summer 2020 another massive gold-bull upleg was maturing, a powerful mean reversion out of March’s stock panic. Like usual the longer and higher gold climbed, the more it attracted the attention and capital of stock traders. As their excitement and greed mounted, they rushed to add shares of GLD and IAU for gold portfolio exposure. This catapulted gold 19.1% higher from the end of May to early August!
During that short span, GLD+IAU holdings soared 12.8% or 200.0t! For the third time in this relatively-young secular gold bull, big gain-chasing summer investment demand easily overpowered gold’s normal summer-doldrums seasonals. While gold had to correct after being bid up to extraordinarily-overbought extremes, it still ended last summer up 13.7% through June, July, and August proper. That was a great summer.
Out of the 48 trading days in that terminal-upleg-climax span, fully 41 saw GLD+IAU holdings builds that averaged a sizable 0.3% each. The big upside impact on gold those ETF capital inflows had is evident on this chart. Gold blasted much higher on momentum buying and fears of the mind-boggling money printing underway at the Fed. That crazy pandemic-paranoia year shattered gold’s summer-doldrums seasonals.
Now summer 2021 still has the potential to prove the third year in a row enjoying outsized investment demand, forcing gold prices much higher. Since a rare extended correction bottomed in early March, gold has powered higher on balance in its fifth upleg of this secular bull. That upside momentum lasted long enough and left gold high enough to start enticing stock-market capital back into those leading gold-ETF shares.
American stock traders had fled during gold’s extended correction, exacerbating it. But as gold bounced in a sharp mean-reversion early upleg, that differential selling in GLD and IAU shares stalled. As gold’s upleg gains mounted, that reversed into buying as investors started chasing this metal’s strengthening upside momentum. That could still flare again this summer, despite the recent FOMC-lobbed monkey wrench.
That mid-June FOMC decision changed nothing, leaving the Fed’s hyper-easy zero-interest-rate policy and $120b per month of quantitative-easing money printing in place indefinitely. It was top Fed officials’ individual outlooks, a third of these guys expecting a couple rate hikes over a couple years into the future, that unleashed fierce gold-futures selling. That leaves gold perfectly set up for a strong mean-reversion rebound.
Despite that hawkish-Fed scare, counter-seasonal gold demand is already modestly evident. In June, GLD+IAU Holdings still edged up 0.4% or 6.8t straddling that Fed-spawned gold-futures purge. If gold rebounds strongly as it ought to given speculators now-super-bullish gold-futures positioning, so will gold investment buying. It is gold’s price action that drives stock traders’ sentiment, governing their gold-ETF buying.
This summer is also seeing anomalous catalysts that could really boost investment demand, which would short-circuit the doldrums again. Chief among them is inflation, the soaring prices Americans are facing in everything. With the Fed continuing to conjure up that $120b per month of new dollars to monetize bonds, the money supply is still exploding. That deluge is bidding up the prices on goods and services universally.
In just 15.4 months since March 2020’s stock panic spawned by governments’ COVID-19 lockdowns, the Fed’s balance sheet has skyrocketed 87.9% or $3,790b higher! That has nearly doubled the US money supply in that short span, fueling soaring prices. The latest Consumer Price Index read in mid-June saw a 5.0% year-over-year headline surge, but that is lowballed with real-world prices actually soaring double digits.
The more speculators and investors worry about inflation, the more capital they will allocate to gold, silver, and their miners’ stocks. Long centuries of thriving during episodes of profligate central banks foolishly debasing their own currencies has crowned gold the ultimate inflation hedge. Gold investment demand should strengthen considerably, even this summer, as the drumbeat of scary inflationary news intensifies.
For many years I’ve thrown in silver and the gold miners’ stocks in my gold-summer-doldrums analyses. Gold’s fortunes drive the entire precious-metals complex. Silver and precious-metals miners’ stocks are effectively leveraged plays on gold. Their summer behavior mirrors and amplifies whatever is happening in gold. So if gold enjoys outsized gains later this summer, silver and their miners’ stocks should do better.
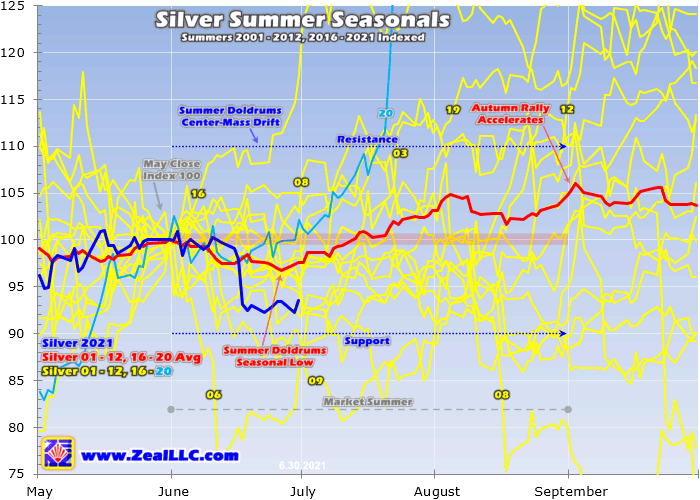
This silver-summer-seasonals methodology is the same as gold’s, showing how it has fared during gold’s modern bull-market years. With a far-smaller global market, silver is much-more-volatile than gold. So its center-mass summer drift is wider, running +/-10% from May’s final close. That implies a summer range between $25.11 to $30.69 this year. But silver’s summer seasonals have proven weaker overall than gold’s.
Silver’s summer-doldrums seasonal low tends to arrive a couple weeks after gold’s in late June. That is averaging June’s 20th trading day, which translated to June 28th this year. And that saw silver being down 3.3% summer-to-date, much worse than gold’s 0.7% average droop at its own summer seasonal low. But silver’s overall seasonal performance in market summers has improved in recent years with gold’s.
During those investment-driven summer gold surges in 2016, 2019, and 2020, silver amplified gold’s counter-seasonal gains. The white metal soared 26.9%, 34.5%, and 61.6% summer-to-date in those same spans where gold powered 12.3%, 19.0%, and 19.1% higher! That made for 2.2x, 1.8x, and 3.2x silver upside leverage to gold. The latter massive silver gains last summer really boosted its seasonals.
Through all these modern-gold-bull-year summers, silver has rallied an average of 4.6% from the end of May to the end of August. That is modestly better than gold’s 3.7% average full-summer gains. A year ago in my last iteration of this summer-doldrums research thread, I was lamenting silver’s serious relative underperformance compared to gold. Then their average summer gains were running just 1.3% and 3.1%.
As last summer’s astounding 58.1% silver soaring proved, this precious metal can blast higher despite the doldrums. But silver is ever-dependent on gold, its dominant primary driver. Traders don’t flock to silver unless gold itself is running in an attention-grabbing exciting way. In order for silver to enjoy large summer gains on big capital inflows, gold needs to be powering considerably higher on flaring investment demand.
That could happen again later this summer, lighting another fire under silver. The gold miners’ stocks are also big beneficiaries of gold strength. For gold-stock summer seasonals, I’m using the older HUI gold-stock index which closely mirrors the GDX VanEck Vectors Gold Miners ETF more popular today. Since GDX was only launched in May 2006, it has insufficient price history to match these modern gold-bull years.
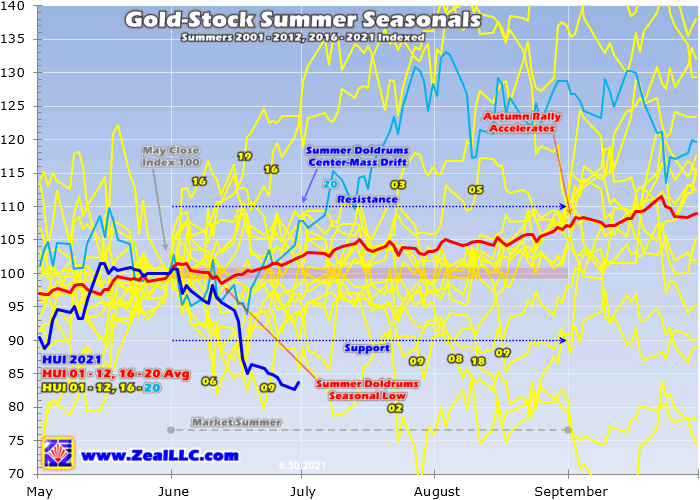
The major gold stocks’ summer seasonals have also improved in recent years, thanks to those big gold surges in 2016, 2019, and 2020. The more-volatile gold stocks also have a wider center-mass-drift summer trading range of +/-10% from May’s final close. In HUI terms that runs from 287.0 to 350.7 this year. Applied to GDX, that equated to a probable summer-2021 trading range spanning $35.48 to $43.36.
Interestingly gold stocks’ average summer-doldrums low comes on June’s 10th trading day, which shook out to June 14th this year. That is right in line with gold’s own summer seasonal low. The gold stocks per the HUI tend to slump 1.4% by then from May’s close, which amplifies gold’s early-summer weakness by 2.0x. The major gold stocks of the HUI and GDX generally tend to leverage material gold moves by 2x to 3x.
On average from 2001 to 2012 and 2016 to 2020, the gold stocks have rallied 2.4% in June, slowed to 0.9% gains in July, and then finished summers strong with big 3.7% surges in August. This compares to +0.3%, +1.3%, and +2.2% for gold in these same market-summer months. Overall from the end of May to the end of August, the HUI has averaged 7.1% summer gains. That’s 1.9x gold’s 3.7% mean rally.
Like silver to a lesser extent, gold stocks fare best during market summers when gold is surging fast enough to generate excitement. That entices traders enjoying summers’ many pleasures back to markets to buy in and chase those gains. In this gold bull’s surging summers of 2016, 2019, and 2020, GDX soared 35.3%, 43.4%, and 28.9% summer-to-date during those spans where gold surged 12.3%, 19.0%, and 19.1%!
That made for 2.9x, 2.3x, and 1.5x gold-stock upside leverage to gold. The latter result from last summer proved really anemic, but that is more of a timing issue. If GDX is instead measured during that entire gold upleg that crested in early August 2020, its 107.9% gains amplified gold’s 40.0% total upleg by an excellent 2.7x. And as GDX didn’t bottom or top on the exact days gold did, its own upleg actually ran +134.1%.
Like usual, gold stocks’ fortunes this summer depend on gold’s. If its young upleg mean reverts sharply higher post-FOMC as gold-futures speculators return, fueling outsized investment demand reinforcing and accelerating those gains, the gold stocks will catch a strong bid. Traders will up their gold-stock portfolio allocations to ride miners’ inherent profits leverage to gold. The rest of summer 2021 still has big upside potential.
If you lack sufficient gold-stock portfolio exposure for these extraordinary times when inflation is soaring, it isn’t too late to get deployed. At best GDX’s current fifth upleg of this bull has only rallied 28.4% so far. The previous four GDX uplegs of this secular gold bull averaged huge 99.2% gains! The trading books of our newsletters are full of fundamentally-superior gold stocks, which are likely to well outperform even GDX.
At Zeal we walk the contrarian walk, buying low when few others are willing before later selling high when few others can. We overcome popular greed and fear by diligently studying market cycles. We trade on time-tested indicators derived from technical, sentimental, and fundamental research. That has already led to unrealized gains in this current young upleg as high as +65.3% on our recent newsletter stock trades!
To multiply your wealth trading high-potential gold stocks, you need to stay informed about what’s going on in this sector. Staying subscribed to our popular and affordable weekly and monthly newsletters is a great way. They draw on my vast experience, knowledge, wisdom, and ongoing research to explain what’s going on in the markets, why, and how to trade them with specific stocks. Subscribe today while this gold-stock upleg remains young! Our recently-reformatted newsletters have expanded individual-stock analysis.
The bottom line is the gold summer doldrums in modern bull years have usually proven much milder than feared. The seasonal weakness tends to be compressed into early June, with gold and its miners’ stocks carving summer lows in mid-June on average. From there gold and gold stocks usually rally on balance in July and August, with gains really accelerating into summer-end. That’s heading into gold’s big autumn rally.
And despite its ugly Fed gold-futures purge, summer 2021 still has good potential to see outsized gold gains fueled by mounting counter-seasonal investment demand. As gold’s current upleg rebounds and mean reverts higher, stock traders will chase it with gold-ETF shares. That differential buying should accelerate even more as inflation fears grow. So gold and its miners’ stocks could easily enjoy another strong summer.
Adam Hamilton, CPA July 2, 2021 Subscribe at www.zealllc.com/subscribe.htm
![]()