![]()
Big US Stocks’ Q3’21 Fundamentals
Adam Hamilton November 5, 2021 3345 Words
Another quarterly earnings season is upon us, led by the biggest US stocks. These massive American companies dominate virtually all portfolios, so how they are actually faring fundamentally is important. Do big US stocks’ underlying corporate earnings justify their record-high prices fueled by the Fed’s epic money printing? Despite fantastic sales and profits in Q3’21, dangerous bubble valuations continue to fester.
The seemingly-endless levitation in the flagship US S&P 500 stock index (SPX) finally faltered a bit last quarter. During the first couple months of Q3, this leading benchmark blasted up 5.6% to 20 new all-time-record-high closes! But then it sold off sharply into quarter-end, plunging 5.1% which proved the SPX’s worst drawdown in almost a year. That left the US stock markets flat in Q3, the SPX edging up just 0.2%.
Stock traders certainly can’t blame the Fed for that major intra-quarter reversal. Its printing presses ran full-speed throughout Q3, spewing out $369b of newly-conjured money that expanded its balance sheet by 4.6%. That was part of the Fed’s vastly-larger fourth quantitative-easing campaign, which ballooned this monetary base by a staggering $4,398b or 105.7% in the 20.0 months since March 2020’s stock panic!
This profligate central bank effectively more than doubling the US money supply has catapulted the SPX an incredible 108.3% higher in that same short span! Those huge gains have greatly bolstered big US stocks’ popularity with investors. They are universally owned both individually and through the mammoth S&P 500 ETFs led by the SPY SPDR S&P 500, IVV iShares Core S&P 500, and VOO Vanguard S&P 500 ETFs.
These monster ETFs’ net assets were running a staggering $420b, $317b, and $269b in the middle of this week! And their holdings are dwarfed by the market capitalizations of the SPX’s 25 largest component stocks. Commanding 42.2% of the S&P 500’s market capitalization as Q3 wrapped up, they were collectively worth a colossal $16,629b! So investors’ capital risked in these behemoths simply can’t be overstated.
Thus after every quarterly earnings season I dive into their latest results, crunching and analyzing these numbers to see how the big US stocks are actually faring fundamentally. The SPX top 25 effectively are the US stock markets, and many trillions of dollars of retirement savings are deployed in these mammoth companies. They are required to provide 10-Q quarterly reports to the SEC within 40 days after quarter-ends.
The great majority have reported Q3’21, but there are some stragglers. Warren Buffett’s mighty Berkshire Hathaway investment conglomerate waits until the last Saturday in that reporting window. Disney’s fiscal years end in calendar Q3s, so its full-year results are published a bit later. SEC deadlines for 10-K annual reports are 60 days. Oddly PayPal isn’t releasing Q3 results until November 8th, 39 days after quarter-end.
The rest of these gigantic American companies have reported, though some operate on fiscal quarters offset from calendar ones. NVIDIA, Walmart, Home Depot, and Salesforce have quarters ending one month after calendar ones, while Adobe and Oracle run quarters ending one month before. So in these offset-fiscal-quarter cases, the latest-reported quarterly data is used despite being less comparable with peers.
This table outlines the key fundamentals of these 25 largest companies in the US stock markets. Their stock symbols are preceded by how their rankings within the S&P 500 shifted in the year since the end of Q3’20. Next their percentage weightings within the SPX at the end of Q3’21 are shown, along with their enormous market capitalizations in billions when last quarter ended. That’s followed by year-over-year changes.
Market-cap changes offer a purer read on companies’ values than stock-price
changes, normalizing out some of the manipulative effects of corporate stock
buybacks. Those are pure financial engineering done to artificially boost
stock prices and earnings per share, which maximizes executives’ compensation.
The Fed’s trillions of dollars of money printing and zero interest rates have
spawned vast buybacks in recent years.
Next comes each of these big US stocks’ quarterly revenues, hard earnings under Generally Accepted Accounting Principles, stock buybacks, trailing-twelve-month price-to-earnings ratios, dividends paid, and operating cash flows generated in Q3’21 followed by their year-over-year changes. Fields are left blank if companies hadn’t reported that particular data as of mid-week, or if it doesn’t exist like negative P/E ratios.
Percentage changes are excluded if they aren’t meaningful, primarily when data shifted from positive to negative or vice versa. Overall these big US stocks reported fantastic results last quarter despite pandemic stimulus payments drying up. But even with stellar profits these lofty stocks remain priced for perfection, sporting dangerous bubble valuations. Their earnings remain far behind growing into their stock prices.
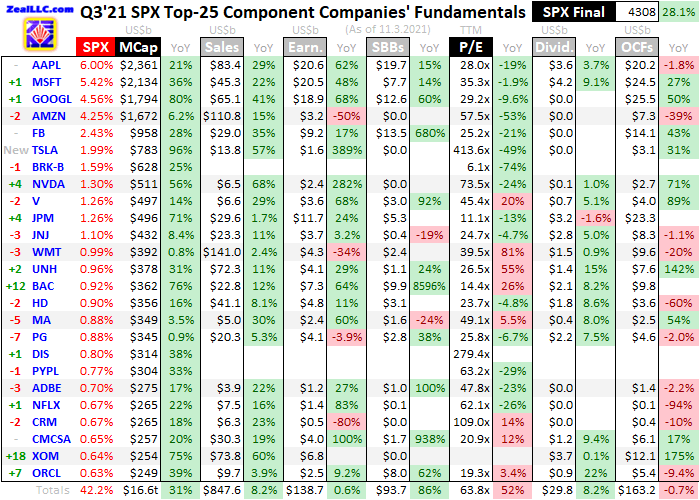
With the Fed finally starting to slow its radically-unprecedented QE4 money printing this week, the big US stocks show what that epic deluge of liquidity bought. Over the past year ending September 30th, the SPX surged 28.1% higher. Its top 25 component stocks shown here modestly outperformed, with their market caps powering up 31.1% in that same four-quarter span. The Fed’s balance sheet grew 19.7% or $1,392b.
As usual the market-darling mega-cap technology stocks led the way, with Apple, Microsoft, Alphabet, and Amazon all seeing their values soar well over a trillion dollars. Throw in Facebook which is changing its name to Meta to pursue Mark Zuckerberg’s virtual metaverse vision and cult-favorite car maker Tesla, and these six largest US companies now account for a staggering 24.6% of the entire S&P 500’s market cap!
Americans’ concentration risk is huge with effectively a quarter of their stock-market capital deployed in just a half-dozen companies. While their sales and profits growth has been amazing, that can’t outstrip the underlying economy indefinitely at their vast operating scales. When these universally-owned and sky-high stocks inevitably get hit on deteriorating results or bad news, they will pummel the broader stock markets.
But credit where credit is due, the Big Five mega-cap techs long dominating the S&P 500’s ranks just had another phenomenal quarter in Q3’21. They continue to well-outperform their peers lower down the SPX-top-25 ranks, a major bifurcation persisting. The Big Five’s astounding and mathematically-unsustainable revenues and earnings growth has long masked underperformance among the other smaller big US stocks.
These elite SPX-top-25 companies’ total sales in Q3’21 climbed an impressive 8.2% year-over-year to $847.6b. If those not-yet-reporting Berkshire, Disney, and PayPal are excluded from comparable Q3’20 results, that revenues growth surges to a major 21.0% YoY! That is really surprising considering the US government’s massive pandemic stimulus payments had largely already been spent leading into last quarter.
Making those enormous sales look even more amazing, the COVID-19-delta wave swept across the US in August and September. That apparently didn’t retard spending much based on these strong Q3’21 results. As usual the revenue gains were concentrated in those Big Five mega-cap techs, which saw their sales rocket up 25.6% YoY to $333.6b! The next-20-largest US stocks lagged with 18.2% gains to $434.7b.
That makes it sound like other companies are almost keeping pace with the elite techs, but that is greatly skewed and distorted by a major SPX composition change. The fastest climber among the SPX’s upper ranks over this past year was oil-and-gas supermajor Exxon Mobil. This is such a huge company that its Q3 sales and profits ran $73.8b and $6.8b! The SPX-top-25 component it replaced from Q3’20 was far smaller.
Coca-Cola only reported $8.7b and $1.7b in revenues and earnings in that same 24th spot a year earlier. So had a far-larger company like XOM not displaced a far-smaller company like KO, the next-20-largest SPX stocks would have seen sales growth of only 3.3% YoY. And that excludes Berkshire, Disney, and PayPal from Q3’20 results since they haven’t reported Q3’21 yet. Mega-cap tech still dominates revenues.
And earnings of course. While Amazon was a troubling outlier with hard GAAP profits plummeting 50.2% YoY, the Big Five still wildly-outperformed the broader stock markets. The $72.3b of earnings reported to the SEC by these mega-cap techs skyrocketed a mind-boggling 39.1% YoY! That more than doubled the still-impressive 19.8% profits growth the next-20-largest stocks achieved without that trio of late reporters.
But again Exxon Mobil bumping out Coca-Cola was a major driver of this boost. Adjusting for that, the big US stocks under those Big Five techs only saw earnings rise 10.7% YoY. That is just a quarter of the extreme numbers the mega-cap techs are putting up. While heretical and militantly contrarian, I seriously doubt their colossal earnings growth is anywhere near as bulletproof as most investors now seem to assume.
Apple’s iPhones and iPads are awesome, but they are ultimately a luxury good. Americans are facing raging price inflation unleashed by the Fed’s insane monetary excesses, pinching them financially. With more and more household income forcibly reallocated from discretionary to paying essential expenses, people can definitely use costly Apple devices longer before upgrading to the marginally-faster latest ones.
Alphabet and Meta, and to a growing extent even Microsoft and Amazon, are dependent on businesses advertising. As the US economy slows and Americans are forced to spend more on necessities including housing, energy, and food as inflationary pressures mount, they will have to pull back on buying other stuff. That will erode sales at those impacted businesses, cutting into their online-advertising budgets.
While Alphabet and Meta are all-advertising, Microsoft and Amazon seem more insulated from an economic slowdown. But they certainly aren’t immune. Nearly 2/3rds of Microsoft’s Q3 revenues came from services, primarily to businesses. As these customers’ own sales flag, they can certainly cut back on information-technology spending. There are many alternatives to Microsoft’s and Amazon’s cloud services.
Even Amazon is facing pressures from chronic supply-chain disruptions and soaring consumer inflation. While that online juggernaut sells endless stuff, almost none of it is as indispensable as housing, energy, and food. As these essential expenses consume more of American budgets, discretionary purchases on Amazon will wane. Most of us are so overloaded with stuff we could cut back on buying more for a long time.
The mega-cap techs’ red-hot earnings growth is an unsustainable anomaly, even if supply chains and inflation were normal. Apple, Microsoft, and Alphabet’s Q3 earnings skyrocketed 62.2%, 47.6%, and 68.4% YoY to super-high levels of $20.6b, $20.5b, and $18.9b! That extreme-double-digit growth can’t go on for long mathematically from such market-share-dominating heights, there aren’t enough profits in the economy.
The big US stocks overwhelmingly plowed their fat Q3’21 profits into manipulative stock buybacks, which is troubling and ominous. Astoundingly the SPX top 25 spent an unbelievable $93.7b buying back their own stocks last quarter alone! That is over 2/3rds of their entire earnings! Those buybacks skyrocketed an incredible 85.5% YoY. If Berkshire, Disney, and PayPal are excluded from Q3’20, that soars to +127.7%!
The kings of stock buybacks remain those mega-cap techs, with the Big Five’s $53.5b in Q3’21 blasting up 59.5% YoY. Those colossal capital inflows are the primary driving force behind the outsized gains in their stock prices. Unfortunately this brazen stock-price manipulation has proven so successful that other companies’ managements are increasingly aping it. The next-20-largest SPX stocks’ buybacks shot parabolic.
They skyrocketed 429.1% YoY to $40.2b without that trio of late reporters! Exxon Mobil wasn’t a factor in this, as it didn’t report buying back any stock in Q3’21. Bank of America and Oracle found their way back into the SPX top 25, and executed monster buybacks last quarter of $9.9b and $8.0b. Some companies’ buybacks exceeded their earnings, led by Meta’s $13.5b up 680.1% YoY compared to just $9.2b of profits!
While companies authorize stock-buyback campaigns that run for multiple quarters, ultimately they can’t exceed earnings. Some companies actually borrow money to buy back their own stocks, abetted by the super-low interest rates spawned by the Fed’s colossal $120b per month of QE bond monetizations. But debt-financing stock buybacks isn’t sustainable for long, so recent extreme levels can’t and won’t persist.
Like individual stock traders, managements making stock-buyback decisions are highly emotional and influenced by herd sentiment. Buybacks flare when stocks are near record highs and greed reigns, but slump after bear markets when psychology waxes pessimistic. And despite the stellar earnings the big US stocks are putting up, they are lagging way behind lofty stock prices. So bubble valuations are festering.
The SPX-top-25 components’ average trailing-twelve-month price-to-earnings ratios soared 52.0% YoY to an insane 63.8x at the end of Q3’21! 14x earnings is historical fair value over the last century-and-a-half or so, while twice that at 28x is where risky bubble territory starts. These Fed-goosed stock markets are extremely overvalued, despite strong underlying earnings growth. This is super-risky in inflationary times.
Interestingly the Big Five mega-cap techs aren’t the most-overvalued today relative to their huge profits. Their P/Es only averaged 35.0x, well into bubble territory but still falling 32.0% YoY. But again when their monster earnings inevitably fade, those valuations should shoot back higher. The next-20-largest US stocks looked far worse in the aggregate, with average P/Es way up at 71.3x which rocketed up 81.0% YoY!
The main culprit is Elon Musk’s Tesla, which has such a cult following that its stock is magically divorced from any conceivable economic reality. TSLA’s terrifying 413.6x P/E was a big 48.7%-YoY improvement, but it really skewed the average. But even without it, the rest of the next-20-largest SPX stocks were still sporting a deep-bubble 52.3x average. Disney’s ugly 279.4x contributed too, without that it drops to 38.9x.
While still way into scary bubble-land, Berkshire Hathaway’s super-low 6.1x is dragging that down. But that isn’t righteous, as it is driven by colossal unrealized gains in this company’s enormous investment portfolio. Trailing-twelve-month P/Es are calculated off the last four reported quarters’ earnings. In the first half of 2021, BRK ran $33.1b of unrealized stock gains through GAAP profits! 2020 saw another +$40.7b.
So if you take out that downside outlier as well as the upside ones of Tesla and Disney, the rest of the SPX top 25 still averaged a bubblicious 39.6x earnings exiting Q3’21. It is incredible to see such extreme overvaluations with such super-strong corporate profits. When inflation and the slowing economy cuts into earnings, these valuations will surge even higher. So these stock markets are exceedingly expensive!
Dividends remain really out of favor with corporate managements as stock buybacks are all the rage. So the SPX top 25’s total dividends only climbed 8.2% YoY last quarter to $29.8b. While Exxon Mobil’s $3.7b was a huge addition, a year earlier Intel and Coca-Cola were in the SPX top 25 and totaled $3.2b in dividends. The thing that struck me about big US stocks’ dividends was how they fit in with buybacks and profits.
Again these elite big US stocks earned $138.7b last quarter and spent $93.7b on stock buybacks. That left $45.0b in profits not squandered into manipulating stock prices and earnings per share higher. Of that, another $29.8b or fully 2/3rds was spent on old-fashioned dividends. These SPX-top-25 companies “returned” 8 out of every 9 dollars they earned to shareholders! Residual earnings added up to just $15.2b.
American companies apparently aren’t doing much investing in their businesses, instead funneling most of their earnings into the stock markets. I can’t see how that won’t hurt their competitiveness in the future. This extreme stock-market euphoria the Fed has recklessly stoked with its colossal QE money printing is greatly impairing capital flows into productive pursuits. The eventual reckoning spawned by this will prove nasty.
In some ways cash flows generated from operations are a purer measure of how companies are faring than accounting profits, which are easily skewed by unusual non-cash items. The SPX top 25 generated $163.2b of operating cash flows last quarter, which only rose 8.6% YoY when adjusted for Berkshire, Disney, and PayPal. All that growth came from those Big Five mega-cap techs, with OCFs up 16.5% YoY to $91.7b.
The next-20-largest US stocks excluding that late-reporting trio only saw dead-flat operating cash flows year-over-year at $71.5b. That is stunning compared to their 19.8%-YoY earnings growth. OCFs are a lot harder to manipulate than accounting earnings, since there are nowhere near as many estimates that feed into them. Elite US companies often play games with their GAAP profits and thus earnings per share.
The mega-banks are a notorious example, where managements estimate future loan losses to set aside reserves for. These charges balloon in bad kitchen-sink quarters when earnings already look poor, leaving them even worse. Then those reserves are “released” in subsequent better quarters, boosting bank profits and EPS. Managements manipulate accounting estimates to exceed Wall Street earnings expectations!
After decades studying the markets full-time and professionally trading, it is discouraging how casino-like and fake these record-high stock markets feel. Had the Fed not more than doubled its balance sheet since March 2020’s pandemic-lockdown stock panic, had corporate managers not chosen to pour all their shareholders’ resources into naked stock-price speculation, these stock markets would look radically different.
With valuations remaining so deep into dangerous bubble territory, caution remains in order here. While stocks have done virtually nothing but rally for a long time, the Fed’s colossal QE4 money printing will end over the next half-year or so. But the much-higher general price levels spawned by that extreme inflation are here to stay. They are going to exert increasing pressure on corporate profits, forcing valuations higher.
Companies facing surging input costs can either eat them or attempt to pass them along to customers by hiking their own selling prices. Absorbing them directly cuts into earnings, but raising prices indirectly does too by lowering sales. Customers faced with higher prices often balk, refusing to pay them for anything but core life necessities. Lower revenues almost always lead to lower earnings, a big problem for lofty stocks.
These extreme stock markets aren’t normal, and serious storms are brewing. The Fed is finally pulling away the monetary punchbowl with super-risky bubble valuations rampant. And raging inflation from the Fed’s printing presses is eroding customers’ financial means to keep buying goods and services from corporations. That makes a major selloff increasingly likely, either a severe correction or new bear market.
What to do? Investors should start lightening their heavy stock allocations by adding 5% to 10% in gold, along with double or triple that in fundamentally-superior gold-mining stocks. They have colossal upside potential from both this tsunami of monetary inflation and these bubble-valued stock markets rolling over. Gold and gold stocks are the best inflation hedges, and outperform dramatically during secular stock bears.
At Zeal we walk the contrarian walk, buying low when few others are willing before later selling high when few others can. We overcome popular greed and fear by diligently studying market cycles. We trade on time-tested indicators derived from technical, sentimental, and fundamental research. That’s why all 1,247 stock trades recommended in our newsletters since 2001 averaged hefty +21.3% annualized realized gains!
To multiply your wealth trading high-potential gold stocks, you need to stay informed about what’s going on in this sector. Staying subscribed to our popular and affordable weekly and monthly newsletters is a great way. They draw on my vast experience, knowledge, wisdom, and ongoing research to explain what’s going on in the markets, why, and how to trade them with specific stocks. Subscribe today while this gold-stock upleg remains small! Our recently-reformatted newsletters have expanded individual-stock analysis.
The bottom line is big US stocks just reported fantastic Q3’21 results, with soaring revenues and earnings. They plowed over 2/3rds of the latter into colossal stock buybacks, manipulating their stock prices and earnings per share higher. But despite those fat profits, the big US stocks continue to trade deep into dangerous bubble territory. Their extreme overvaluations are very risky, especially if profits weaken.
Unfortunately that’s increasingly likely with the raging price inflation unleashed by the Fed more than doubling its monetary base recently. That vast deluge of new dollars is going to remain in the system even after QE is fully tapered. Higher input prices directly cut into corporate earnings, while hiking selling prices erodes sales further damaging profits. Weakening earnings are a serious threat with bubble valuations.
Adam Hamilton, CPA November 5, 2021 Subscribe at www.zealllc.com/subscribe.htm
![]()