|
|
|||||||
|
|
|
|
|
|
|
|
|
|
|
|
|
|
|
|
|
|
|
HUI Bull Seasonals 3 Adam Hamilton August 13, 2010 2604 Words
Precious-metals stocks really haven’t had a great summer by any means. After rallying initially in June, they started relentlessly drifting lower in July. The net result of this lackluster summer trading is a lethargic drift sideways. Naturally this listlessness has weighed on sentiment among this sector’s traders.
At the end of May just before the dawn of the financial-market summer, the flagship HUI gold-stock index closed at 454. Since then, it has generally been flat averaging just 458 on close. At best so far this summer, the HUI was up 8.8% in mid-June. At worst, it was down 4.7% in late July. For a sector accustomed to wild volatility and exciting action, 10 weeks of drifting can feel very discouraging.
But it shouldn’t be. Gold stocks almost always tend to drift sideways to lower in the PM summer doldrums. Such uninspiring behavior is par for the course this time of year. I wrote an essay explaining the research behind the PM summer doldrums that was published the very day the HUI peaked this summer (June 18th). At that time when traders were pretty excited about PM stocks’ prospects I concluded…
“The bottom line is summer isn’t a great time for precious metals. Led by gold, the entire PM complex tends to drift sideways to lower in the summer doldrums in June, July, and August. This listless price action is driven by the combination of no seasonal gold-demand surges and the general lack of investor interest that plagues all markets in the summer months. Sun, sand, and surf simply provide too much competition for traders’ attention this time of year.”
But today a couple months later, the financial-market summer is starting to wane. We’re on the verge of emerging out of the wilderness that was the summer of 2010. After forming a relentless headwind retarding gold stocks’ progress this summer, the major seasonal influences affecting this sector are shifting back towards a favorable tailwind. The HUI bull seasonals are looking up, a very bullish omen.
Yes, believe it or not seasonals do affect gold-stock price levels! This probably sounds counterintuitive initially. Investors and speculators can buy and sell gold stocks anytime regardless of the passing of the calendar year, so why does the time of year matter? The answer is quite logical. It matters because calendar seasons greatly affect gold investment demand, and the gold price is the primary driver of gold stocks’ ultimate profits. When it rallies, they rally. And when it falls, they follow.
Gold seasonals are extremely important for all PM-stock traders to understand. Read my latest essay discussing them in depth if you are not up to speed. In a nutshell, deeply-ingrained income-cycle and cultural incentives drive big gold demand spikes in the autumn, winter, and spring. But in the summer, there is nothing to drive above-average capital inflows into gold. Thus it tends to grind sideways to lower, and the gold stocks trail in sympathy.
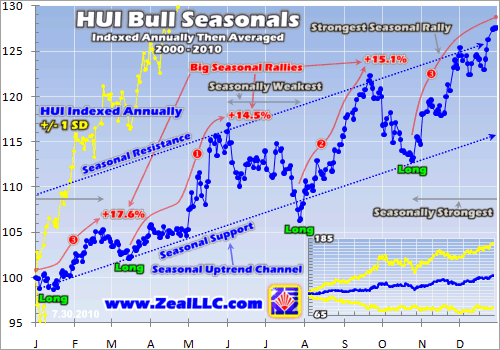
These gold-driven seasonal trends are readily apparent in the HUI. Since markets behave quite differently in secular bulls and bears, I like to start my seasonal analysis when today’s secular gold-stock bull was born in 2000. To distill out the HUI bull seasonals, I individually index each calendar year’s HUI action from the first day of that year. This ensures percentage changes within each year are perfectly comparable across years despite the HUI trading at progressively higher levels as its bull marches on.
Finally I average together all these individual-year HUI indexes and chart the results. This process reveals the HUI bull seasonals rendered below, which are very valuable for traders to understand. Regardless of everything else going on in the markets, gold stocks tend to be consistently strong and weak at certain times of the calendar year. These tendencies can be used to help investors and speculators execute superior trades.
It’s been two-and-a-half years since I last updated this thread of research, with an epic discontinuity defining the period since. During that crazy once-in-a-century stock panic we weathered in late 2008, gold stocks were ripped to shreds in the belly of the beast. Between July and October 2008, the HUI plummeted a jaw-dropping 67.7%! And around half these losses accrued in this span’s final month alone! It was not a fun time to own PM stocks.
Then between its brutal October 2008 lows and the end of that year, the HUI rebounded 99.5% higher. This index has never witnessed anything remotely like that panic span, so I was really curious about how such wild swings would alter the HUI’s seasonals. Surprisingly though, the blue HUI seasonal line in this chart didn’t change too much at all. This shows the value in averaging over a decade’s worth of years. No one year, even one as crazy as 2008, wields an outsized influence.
On average since 2000, the HUI has rallied around 27.6% per year (from an indexed level of 100.0 to 127.6). These are stupendous gains over an ugly decade where the general stock markets have languished in a secular bear. As a matter of fact, on the day the HUI bottomed in November 2000 the flagship S&P 500 stock index closed at 1383. Today a decade later it is 21% lower while the HUI is 1151% higher! Gold stocks have been a spectacularly-lucrative investment since 2000!
In this secular bull the HUI has tended to trade in the well-defined seasonal uptrend channel shown in this chart. It hits its seasonal support four times a year, in mid-January, mid-March, late July, and late October. These are the best times of the year seasonally to add new gold-stock and silver-stock positions for investors and speculators alike. Your odds of “buying low” around these support approaches are far better than they are the rest of the year.
Out of these major seasonal lows, the HUI’s largest seasonal rallies of the year emerge. The first runs from mid-March to early June and has averaged 14.5% over the course of this gold-stock bull. As long as gold stocks aren’t radically overbought in March, we diligently play this strong spring gold-stock rally every year. Our subscribers have made lots of money over the years buying PM stocks with us around mid-March and then selling them in late May or early June.
After this first big seasonal rally, the PM stocks enter the dreaded summer doldrums. They tend to drift sideways to lower for much of the summer. The summers are, without any doubt, the weakest time of the year for the gold stocks seasonally. Every year in May I warn our subscribers about these dangerous PM summer doldrums. They not only result in real trading losses and even bigger opportunity costs, they can really devastate traders’ psychology and confidence.
The second big seasonal rally of the year erupts out of exceptionally-oversold HUI lows in late July. It tends to run 15.1% higher on average between late July and late September. Of course right now, in mid-August, we are early on in this HUI seasonal rally. This is very encouraging and ought to excite PM-stock traders bummed out from weathering the summer doldrums. PM stocks almost always rally big heading into autumn, and statistically this seasonal rally is probably already underway.
If you follow our research work at Zeal, you are probably scratching your head at this point. I imagine you thinking, “But Adam, you often write about a mid-August seasonal low. Doesn’t this late-July HUI seasonals data contradict this?” Yes, it certainly does. But this apparent contradiction highlights the supreme importance of broad and well-rounded research. Indicators must be considered in concert, not isolation, to optimize trade timing.
Remember that gold stocks (and silver as well) are ultimately driven by the fortunes of the gold price. If gold is weak, the entire gold complex has a tough time rallying. And gold seasonals bottom in mid-August. Of course silver seasonals dutifully follow gold, bottoming between mid-August and mid-September. And just last week, my business partner Scott Wright published some landmark research on junior seasonals. Junior gold stocks are hyper-sensitive to gold sentiment. And when do they bottom? You guessed it, mid-August!
So if you want to buy PM stocks in late July due to these HUI bull seasonals, your odds for success are high. And indeed this year, the HUI’s 432 low on July 27th may indeed prove to be summer 2010’s closing low. But I’ve seen plenty of really ugly HUI selloffs into mid-August, like 2007’s sharp 13.6% loss over 6 trading days ending August 16th. So personally, I feel more comfortable waiting for the probable mid-August gold lows before adding new long positions. Gold is gold stocks’ primary driver.
The HUI tends to see another seasonal pullback in October. Provocatively, the wicked-sharp plunge in October 2008’s stock panic stretched this seasonal tendency considerably. Prior to that anomaly, the HUI tended to bounce in the middle of its seasonal uptrend in mid-October, not near support as this latest seasonal chart shows. Since that panic was such an exceedingly-rare event, I certainly wouldn’t hold out for a seasonal support approach in Octobers in general. But an early-October pullback is still highly probable.
The third big seasonal rally launching out of October’s low actually lasts until late February of the following year. All together it accounts for a 17.6% average HUI rally over this past decade, which makes it the seasonally-strongest time of the year for gold stocks. So as long as gold’s fundamentals remain bullish, and neither gold nor the gold stocks have just rapidly spiked to very-overbought levels, it is prudent to be heavily long gold stocks in the winter. Throw in autumn and spring as well, for the other two big seasonal rallies.
So boiled down, these HUI seasonals are really pretty simple. Expect weakness in summer since there is nothing then to drive gold investment-demand spikes. If you are an investor, just gird yourself psychologically for this weakness and don’t get caught up in it or worry about it. If you are a speculator, you can sell long positions between late May and early June and then redeploy between late July and mid-August. And then stay long and deployed for the rest of the other three seasons.
This simple truth is so powerful and really highlights the value of expert market research for all traders. Every year without fail, I receive tons of e-mails from discouraged PM-stock investors and speculators in this late-summer timeframe. They are frustrated, discouraged, and have either given up on PM stocks or are considering capitulation. Yet if you study the markets, or spend a little time and money learning from those who do, there is nothing to fear in the summer. Don’t expect too much, and you won’t be let down.
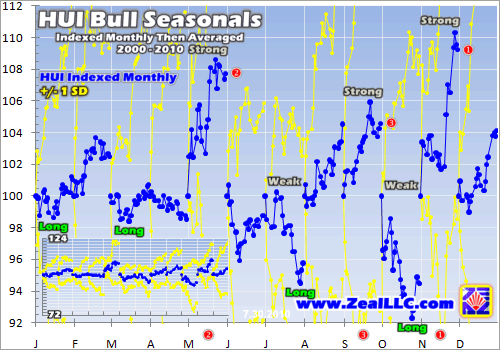
This next chart takes an alternative view of HUI seasonals, this time dissected monthly. Every calendar month of this gold-stock bull is individually indexed, and then each month is averaged with the same months across all other calendar years. In addition, as in the first chart above, standard deviations are rendered in yellow. The smaller inset charts show the full range of these standard deviations.
Standard deviations, of course, are measures of dispersion. When you are running averages for market-analysis work, the tighter the underlying data the higher the probability your average is meaningful. The narrower the yellow bands (closer to the core blue average), the less dispersed the underlying data is. The sequences 4, 5, 6 and 0, 2, 13 both average 5, but obviously the tighter first one is more likely meaningful.
In calendar-month terms, November, May, and September are the best months for the HUI on average. We are talking gains of 9.2%, 7.7%, and 4.6% respectively. The worst months of the year for gold stocks on average are October and July. This is skewed by the panic October and November of 2008, however. While these two months were still weak and strong pre-panic, they weren’t as extreme as they look above.
The 2008 panic and its 2009 aftermath had a much more-pronounced impact on the smaller monthly seasonal datasets than it did on the annual ones. It flattened January, March, and August while extending October and November. If you want to see the panic changes with your own eyes, compare this chart to the last one I built before the panic with data current to February 2008.
These monthly seasonal tendencies reinforce the annual analysis. Summers, especially June and July, tend to be weak during the PM summer doldrums. August looks strong above in monthly terms, but realize most of these gains merely offset July’s big losses. The result is the flat late summer seen above on the annual chart. But once summer passes, gold stocks tend to rally on balance in most months except October. While they can drift lower other times, these non-summer pullbacks tend to be trivial.
So once again the core thesis of the HUI bull seasonals emerges. Write off summer, but make sure you are deployed in high-potential gold and silver stocks for the autumn, winter, and spring gold rallies. Thanks to summer’s dampening effect on sentiment among naive PM-stock traders, this time of year almost always sees nice bargains in PM stocks. August is the perfect time to stock up and prepare for the highly-probable large autumn gold rally.
Gold tends to rally sharply in autumn because of big Asian buying. After harvest, farmers can invest in gold once they know how big their profits are. And gold demand in India in particular, the world’s largest consumer, rockets higher during autumn’s festival season. If you have any Indian friends, ask them about Indian wedding season. It is fascinating and often drives big gold rallies which PM stocks leverage.
Which stocks to buy? We can help you with that. At Zeal we deeply research entire PM-stock sub-sectors (gold producers, silver stocks, advanced-stage junior golds, early-stage junior golds) to uncover what we believe are the best stocks fundamentally. We publish comprehensive profiles of our dozen favorite stocks (out of initial universes often in the hundreds) in our popular Zeal Reports. You can enjoy the benefits of hundreds of hours of our expert research for a mere pittance. Buy a PM-stock report today and take advantage of the late-summer bargains!
We also publish acclaimed monthly and weekly newsletters that are invaluable to investors and speculators. All of our research and wisdom flows into these products, helping traders better understand what is going on in the markets, why, and how it can be profitably traded. There is no need to ever be anxious about the financial markets! The more you understand, the less you will worry and the better you will do. Subscribe today and take charge of building your personal fortune!
The bottom line is precious-metals stocks have exhibited very definite seasonal tendencies over the course of their secular bull. This is largely the result of gold demand spikes driven by income-cycle and cultural factors that are tied to the calendar year. While PM-stock seasonals are often secondary drivers that can be temporarily overridden by short-term technical and sentimental extremes, prudent traders still pay close attention to these headwinds and tailwinds.
HUI bull seasonals show investors and speculators when they have the best odds of buying low and selling high. They reveal that summer tends to be a poor time of the year for PM stocks, but the rallies in autumn, winter, and spring far more than make up for these summer doldrums. They also show that our current mid-August timeframe is one of the best times of the year to add new long positions.
Adam Hamilton, CPA August 13, 2010 Subscribe |
|||||||
|
|
|
|
|
|
|
|
|
|
|
|
|
|
|
|||