|
|
|||||||
|
|
|
|
|
|
|
|
|
|
Base Metals Technicals 3 Scott Wright April 13, 2007 3596 Words
So far this year a sense of uneasiness has gripped the financial markets. Volatility has finally peeked its head and the market players are on the edge of their seats trying to anticipate the next exciting move. While economists scrutinize every piece of data that comprises their crystal balls, the stock markets are teetering on what could be the pinnacle of their grand cyclical bull market.
While the general stock markets linger in a wait-and-see mode, commodities have had a fine start to their new year. The headline commodities of oil and gold have fared nicely so far in 2007 as they continue in their respective secular bull markets.
Many other commodities have also performed well this year as seen by the fact that the Continuous Commodity Index is still within spitting distance of its nominal all-time highs. Among these commodities are the hard-working industrial metals that are so critical to our current massive global economic build-out, the base metals.
Like the precious metals, base metals are finite in nature and are extremely difficult and costly to extract from the earth. With demand for these metals skyrocketing led by the emerging and fast-growing Asian economies, the mining industry has been pinched in supplying the marketsí needs.
This structural deficit that has emptied global stockpiles and drastically raised the prices of these metals has caused increasingly volatile futures markets. Though I believe fundamentals have and will continue to drive the base metals, this unique sector has now become a mecca for adrenaline-junkie speculators.
Copper, zinc, nickel, lead and aluminum are the powerhouse base metals that have the most exposure worldwide and are the most active among the major global commodities futures exchanges. This time last year each of these base metals was in the process of achieving all-time highs with several of them in the midst of massive parabolic ascents.
But the 2006 success of the base metals drew a lot of skepticism as to whether these amazing gains were sustainable. A lot of critics came out of the woodwork claiming that the base metalsí gains were unsustainable, unwarranted and that a massive crash in all these metals was imminent.
It is in fact true that even within sound fundamental uptrends, technical blow-offs are necessary and do happen in order to balance sentiment. Markets simply cannot perpetually rise. Corrections are actually healthy and quell euphoria quite nicely. But were these critics prophetic in their calls for a base metals crash?
Now it is very important for active traders to be in tune with the technical nature of a fundamental bull market. Technicals paint a picture of the past and can assist in the timing of trades in the future. And cyclical corrections within secular bulls actually provide excellent buying opportunities.
The base metals have been fascinating to watch from a technical perspective. In 2006 there were some wild parabolic surges that are typically only seen toward the ends of bull markets. But since fundamentals point towards the base metals prospering for at least another decade, it was sure going to be interesting to watch the corrections unfold.
And though exciting, these hugely volatile moves make it increasingly difficult to establish a technical trading pattern. The last time we looked at base metals technicals was late spring of 2006. My business partner Adam Hamilton penned the previous essay in this series just as many of the base metals were beginning their corrections. Almost a year later Iíd like to take a look at how these corrections unfolded and where we stand in each of these major base metalsí secular bulls.
Iíll kick off this analysis with copper, the metal that most traders dub the king of the base metals. And this is seemingly true as even on CNBC when real-time metals quotes are periodically displayed, the banner always shows gold, silver and copper. Traders often use copper to capture the pulse of the base metals sector.
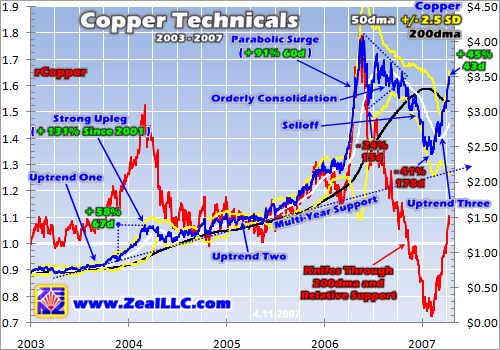
Copper surpassed its 1988 all-time nominal high in May of 2005, and then proceeded to more than double from there over just the next 12 months to achieve its new all-time high of just over $4.00 per pound. As you can see in this chart, copper has had an amazing run in its bull market. From its low in 2001 to its high last year, copper has risen an incredible 575%.
As all good things must come to an end, copperís very strong multi-year uptrend finally peaked in an unsustainable parabolic surge. In just 60 trading days last spring copper surged 91% in speculative fashion before the inevitable correction ensued. As mentioned, fundamentals are ultimately the core drivers of the base metals prices. But even fundamentally strong uplegs can get ahead of themselves and succumb to speculative excitement.
To compare and contrast the weight speculation can bear on uplegs, we can use the 2003/2004 upleg to make a good case for a primarily fundamentally driven surge. And the aftermath of the quasi-parabolic run that capped this upleg shows why. It was during this period of time that massive copper buying was coming out of China and global copper stockpiles were dropping dramatically. All this activity spawned an impressive end-of-upleg rally that saw copper jump 58% in just 67 trading days.
These types of gains are typically unsustainable, but because the fundamentals were so strong, only a modest 18% correction came off the top before copperís bull continued to charge higher. Over the course of the next couple years leading up to its flashy 2006 parabola, copper trended higher proving that global supply and demand fundamentals were the drivers of its 2003/2004 upleg, not speculative fervor.
With copper growing stronger and more popular by the day over 2004 and 2005, speculative capital, much being funneled through hedge funds, joined the crowd of those bidding on copper and eventually drove it to its interim peak in parabolic fashion. But as we all know parabolas are unsustainable due to the exponential increase of capital required to maintain them, so the ensuing correction is often swift and steep as buyers grow sparse while speculators run for the gates locking in their gains.
Perhaps $4.00 copper will have fundamental and technical support at some point in this bull, though 2006 wasnít the year. Copper was far too overbought for this to happen. But surprisingly the initial panic selling off the top of this parabola wasnít as bad as many people feared. After an initial 24% decline in just 15 trading days, copper began a sideways consolidation that was still pretty high considering the slope of its parabola. This consolidation took the form of a wedge until it broke out of its pattern to the downside several months later.
This breakout to the downside eventually dragged copper below $2.50 and had commodities gurus of all sorts wailing and gnashing their teeth. After a 178-trading-day trip from its apex, copper shed 41% to what appears to be a major interim low from where our current upleg has launched. Interestingly even though the breakout to the downside was perhaps just a continuation of technical pruning, it was fundamental news that freaked-out copper traders.
One of the major catalysts to copperís breakout to the downside in the fourth quarter was the rising LME stockpiles. From mid-October to the end of January copper stockpiles doubled to just over 200,000 metric tons. There has in fact been a strong inverse correlation between price and stockpile levels for the base metals, but this particular increase spooked copper speculators and drove its price to its low earlier this year.
As the stockpile level flattened and turned to the downside again, copper began its next powerful upleg that we are in the midst of today. Traders have also started to realize that a 200,000 metric-ton stockpile is still historically low. Considering that in 2002 LME copper stockpiles were at 1 million metric tons, it is apparent that demand is still outpacing supply.
Now after knifing through its 200-day moving average and relative support zone to its February low of $2.40, copper is in the midst of an impressive recovery and renewed upleg that is quickly carrying it back towards its parabola-induced high. In just 43 trading days copper has rocketed 45% to interim highs achieved just this week! The copper bull is not over as many skeptics had been so eager to claim. It will be interesting to see where this upleg takes it.
The next of the exciting base metals is zinc. And this zinc chart looks awfully familiar to copperís chart up until about the fourth quarter of 2006. Like copper, zinc stockpiles have been ravaged over the last few years and are even still at levels that are alarmingly low. Zincís fundamentals are driving quite a technical climb.
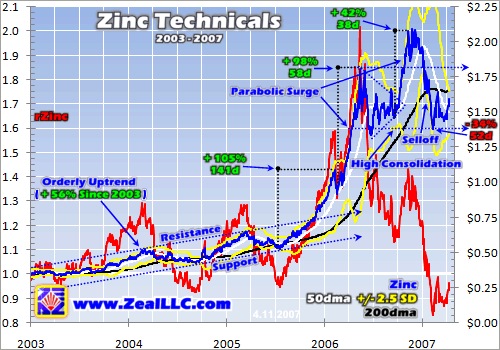
What an amazing run zinc has had so far in this commodities bull. From its low of $0.34 in the first half of 2003, zinc has risen an incredible 523% to its recent November peak. The rarely thought-about zinc miners of the world have really cashed in on the recent success of their metal and like the other base metals miners are struggling to keep up with demand.
Like copper, zinc had a fairly orderly uptrend up until the latter half of 2005. Huge Asian demand mixed with a little speculative excitement prompted three distinctly powerful rallies that shot zinc well out of its trend channel to far exceed its all-time nominal highs. The first of these monstrous rallies peaked in the first quarter of 2006 and happened in quasi-parabolic fashion.
In just 141 trading days zinc shot past the $1.00 mark for the first time ever and rewarded speculators that were long with a quick double. On the chart above, this first major rally doesnít quite show the parabolic-type strength as well as the next two. But when you step back and view it on a longer-term chart it looks almost like a straight line, something zinc has never before witnessed.
Now the types of parabolic rallies demonstrated by this first one are typically unsustainable and almost always end poorly for those caught at the top. But to show zincís fundamental strength this 105% rally only had a very minor correction of 16% over 7 trading days before it entered into a textbook-perfect parabola that gave zinc another double over the next 58 trading days. In less than a year zinc climbed 242% before it decided to cool off a little.
In the second quarter of 2006 all the base metals took a breather off their highs with what seemed to be post-parabola-type corrections. And zinc was not excluded from this initial action. In just 18 trading days zinc shed 26% before it settled into a wedge-shaped consolidation similar to that of copperís.
But instead of breaking out to the downside like copper, zinc rocketed higher yet again to form another parabola, on a smaller scale than the previous two, to achieve new highs. In just 38 trading days zinc shot through the $2.00 mark and powered higher by 42%. Though the core of this zinc rally was driven by fundamentals that had seen the pilfered LME stockpile levels sink to only several days worth of daily consumption, a sizeable speculative risk premium was placed on this volatile metal.
With the continually declining zinc stock finally leveling off in the last few months, speculators locked in their profits and zinc once again languished into a consolidation zone. After a 52-trading-day 34% loss, it now looks like zinc is settling in to a longer and higher consolidation band off its huge 2006 parabola. A good portion of the euphoria has been bled off zinc in the last several months, but its levels today still would have been unimaginable just two years ago.
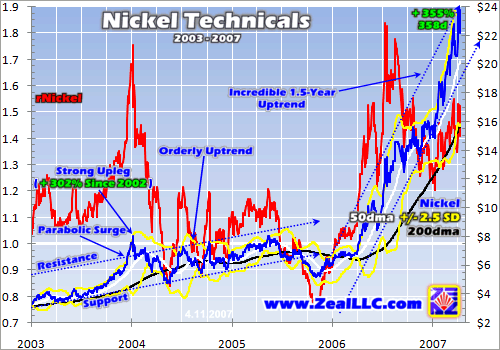
Now the nickel technicals are something to marvel at. This chart is simply mind-blowing. Nickel has been relentless in its march higher and has far and away been the best performing of the major base metals. Since its low around $2.00 in late 2001, it has soared over 1,000% to recent highs over $23.00 achieved just this week.
In a bull market that started in 2001, nickel climbed an incredible 302% to its beginning-of-2004 high that capped a nice parabolic surge. As with most post-parabolic action, nickel corrected sharply to the support of what turned out to be a multi-year uptrend channel. When this channel broke to the downside toward the end of 2005, only in a speculatorís wildest dream would he have imagined that nickel was preparing for a quadruple over the next 1.5 years.
With stainless steel demanding 2/3rds of all the nickel supply, its amazing growth over the last fifty years in the Western world along with skyrocketing stainless steel growth coming out of China this decade has pinched the nickel miners. LME stockpiles continue to hover around record lows, with under two days worth of global nickel consumption available at this time.
With global stockpiles so low, imagine if there was a supply disruption on the mining front. This would surely wreak havoc on the nickel markets. Because of this, I believe nickel traders have built a significant risk premium into todayís price. So until enough nickel is brought to market to push up inventory levels, speculators will likely keep nickel very high.
And high is where the price of nickel remains today. Since its 2005 low of just over $5.00, nickel has soared over 350% with little letup in its steep uptrend. A loose trend channel can be drawn over the last 1.5 years or so that has seen some mini parabolas and minor corrections, but in general nickelís trend is up and up. With this slope though I find it hard to envision a breakout anywhere else but to the downside in order to shed exuberant sentiment.
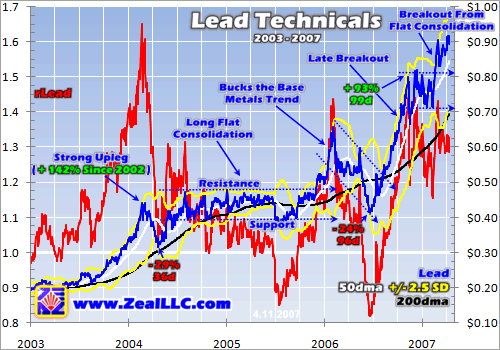
A first glance at leadís chart shows that it took a slightly different path than the other base metals. Similarities abound in its strong 2003/2004 upleg where it ended up gaining 142% from its late 2002 lows. But when LME stockpiles began to flatten from their falling trend in 2004 and 2005, base metals traders forgot about lead.
After a sizeable correction that shed 29% from leadís 2004 top in just 36 trading days, it rebounded over the next several months and proceeded to reside within a long and flat consolidation off this top for nearly two years. Then after a strong upleg off leadís 2005 low to its high in early 2006, a 76% gain, it did something peculiar that bucked the typical base metalsí trend.
In the first half of 2006 when the other base metals were shooting to the moon, lead took the opposite path and entered into a nearly six-month downtrend. In 96 trading days lead shed 24% and appeared to be the plague of the commodities world. You would have thought we were back in the 1970s and 1980s when environmental drawbacks from lead usage in paints and gasoline were gnawing at this metal.
Speculators did actually have a fundamental reason to sell lead though during this time as LME stockpiles were starting to build again, but this was short-lived. As you can see in the chart, lead put the brakes on its slide and began another very strong upleg at the midpoint of last year. In just 99 trading days lead nearly doubled rocketing 93% higher before taking a quick breather.
After a modest correction off the top of this powerful upleg, lead consolidated horizontally showing that this dramatic rise had a fair amount of fundamental backing and that it wasnít quite ready to give up its ghost. In February lead then showed it was not yet done with this upleg and broke out on the high side of this consolidation to continue its amazing run with yet another all-time high being achieved just this week. Lead is now up an incredible 402% since its 2002 low and traders have seemed to open their eyes once again to this indispensable metal.
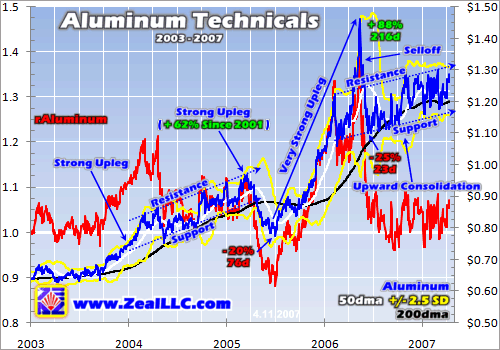
The last major base metal is aluminum. This metal is probably the least exciting of the base metals from a speculative perspective, but this titan is no slouch in the mining sector. As measured by volume, aluminum is the king of the base metals. More aluminum is mined each year than copper, zinc, lead and nickel combined.
And looking at aluminumís chart it does indeed mirror the general base metals story, just not at the same magnitude as the others. From its low in 2001 to its recent all-time nominal high last year, aluminum is only up 145%. Now this gain is certainly nothing to turn your head at, but it is much smaller than the other base metals.
Overall aluminumís upleg appears to be more orderly than the other base metals. Like the others it had a strong 2003/2004 upleg that produced a solid uptrend off of its highs. Then after an early 2005 correction aluminum rocketed to its high near $1.50 that capped off a quasi-parabolic surge.
After a steep selloff to balance sentiment that shed 25% in only 23 trading days, aluminum settled into an upward consolidation trend channel that has been going strong for over a year. Like many of the base metals, aluminum and its countless uses is integral to the massive infrastructure build-out worldwide. With many of the developing nations still just getting started in their build-outs, aluminum demand should be strong for quite some time.
Well after looking at these base metals technicals, I am just amazed at their resilience. These charts show very strong uplegs and parabolic surges that are frankly a rarity at the early stages these metals reside within their secular trends. Time and time again the base metals have resisted the calls to crash and have continued to power higher.
Some very-measurable fundamentals in the stockpiles of these metals have allowed the speculators to take hold of the base metals markets. But in what appeared to be pure speculative fervor that drove the swift ascents of the sharp 2006 uplegs, the resilient technicals since have continually defied this logic. Many folks are starting to take the fundamentals a little more seriously since the prices did not crash or even correct to levels where many thought they should go.
From a technical perspective it is indeed difficult to assess the futures of these metals and establish any sensible trading patterns. These sharp uplegs raised the moving averages to levels that many technicians still cannot swallow. While copper, zinc and aluminum continue to hover around their 200dmas and nickel and lead are well above, many are still trying to figure out where a true level of support should be for these base metals.
Ultimately the fundamentals are going to drive the technicals of the base metals markets. And there are indeed speculative risk premiums built into the prices of these base metals today. But it all depends on supply and demand to steer the strategic direction of the base metalsí prices.
Regardless of where prices go in the near term, the way to profit on these strong base metals is through the stocks of the companies that mine them. Through many years of bear-market-low prices, the base metals producers have learned to structure their businesses to profit on historically low prices. But at the price levels we are seeing today, these companies are sporting enormous profit margins on each pound of their respective metals produced.
Even if prices retreated from todayís levels down to long-term support levels that the initial bulls were building, these miners would still be incredibly profitable. These profits are reflected in the rapid appreciation of the base metals stocks of late. In a base metals stock report we published in September, the 20 companies we profiled have performed incredibly in just the last seven months. Many of these profiled stocks now have well over triple-digit gains since, and the average return is over 40%.
But there are still incredible opportunities to add base metals stocks to your portfolios. At Zeal we are always watching for these opportunities and when the technicals are highly favorable we recommend trades to our newsletter subscribers. If you are interested in cutting-edge commodities market analysis and actual trade recommendations for not only base metals stocks but a variety of commodities stocks, then please subscribe today to our acclaimed monthly newsletter.
In addition to exclusive access to what we decide to trade and when, our subscribers also gain access to a large selection of private charts on our website. This collection includes high-resolution versions of base metals technicals charts that are updated weekly as well as long-term base metals charts that provide a historical context so that you can follow the progress of these ongoing base metals bulls yourself.
The bottom line is base metals technicals show these metals now trading in a territory that most would have never believed possible just a couple years ago. But although these perpetually high base metals prices have very strong support from their wildly bullish fundamentals, even the strongest of bull markets needs to periodically regress in order to balance sentiment.
I do not believe we are in a sentiment storm on either side of the emotional spectrum currently, but regardless of where these metals go in the future, the base metals miners are going to have money trees growing within their land holdings. Because the technicals of these base metals have defied conventional flows and ebbs, the stocks of their miners are what investors need to be watching.
Scott Wright April 13, 2007 Subscribe |
|||||||
|
|
|
|
|
|
|
|
|
|
|
|
|
|
|
|||

