|
|
|||||||
|
|
|
|
|
|
|
|
|
|
|
|
|
|
|
|
|
|
|
Trading the Oil Bull 3 Adam Hamilton October 21, 2005 2813 Words
After powering 42% higher so far in 2005, rising crude oil prices are increasingly dominating the popular market psyche. Indeed it is hard to have a conversation with anyone these days without gasoline prices entering the discussion.
Unfortunately the hurricanes have distorted the popular perception of why oil prices are rising. While the Gulf storms certainly temporarily interrupted oil imports along with US oil production and refining capacity, oil has been rising since 2001 in a secular bull. Global oil demand growth has exceeded global oil supply growth for many years now and these powerful fundamental trends show no signs of abating.
Since rising oil prices impact so many areas of our lives, the incendiary topic of oil prices seems to generate more emotion than any other commodity. I suspect most Americans today have a hostile view of oil since rising gasoline prices directly erode disposable income. And I can’t even count the number of conversations I have had with people utterly convinced that big oil companies withhold production to artificially boost prices.
In the financial markets any emotions, favorable or adverse, only serve to cloud the judgment of investors and speculators. Oil prices, like any prices, should be viewed with cold neutrality. Price trends are never intrinsically good or bad, they just are. The markets are morally neutral. And rising oil prices are not the consequence of some dark conspiracy but part of a vast global market driven solely by world supply and demand, including you and me buying gasoline.
It is in this spirit that investors and speculators should approach this ongoing oil bull. Our personal feelings about paying more for oil products than we may like are meaningless. The real question every market participant ought to be asking himself is how can we profit from this ongoing oil bull? And can it be successfully traded using technical buy and sell signals?
After carefully watching and analyzing this oil bull since it launched, I am convinced that it can indeed be profitably traded. And the same tools speculators use to define high-probability-for-success points to buy and sell can also be used by long-term investors to optimize their buy timing. Despite popular perceptions of perpetually rising oil prices, this bull has actually flowed and ebbed like just like all other bull markets.
The key to trading this oil bull lies in understanding and quantifying the periodic healthy bull-market corrections that punctuate this commodity’s powerful primary bull-market uptrend. In order to buy low and sell high, regardless if one is trading in oil futures or oil-producing-companies’ stocks, oil’s periodic corrections must be identified in a timely manner and prudently utilized.
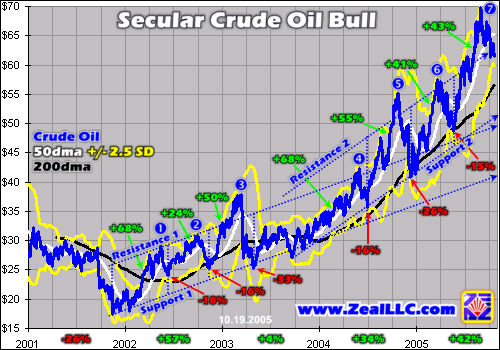
The best way to gain an understanding of oil’s rhythm so far in this bull is to analyze its bull-to-date price chart. Usually oil is rising in a major bull-market upleg but periodically these uplegs get overbought and a short-term correction becomes necessary to rebalance psychology in the oil markets. This oil bull is already behaving like all major bull markets tend to, with its major upleg-correction cycles becoming somewhat homogenized.
Trough to peak on this nominal chart, oil has blasted a staggering 300% higher, or quadrupled since late 2001! But as is readily apparent when this whole bull is viewed in context, oil prices have not been rising constantly to achieve these spectacular gains. They rally then correct, advancing this bull two steps forward before dragging it one step back. The seven major oil uplegs so far and their following corrections are highlighted above.
These uplegs and their subsequent corrections are the first clues on timing oil-related trades. If the percentage gains of all these uplegs are averaged, they yield an average expected upleg gain of 50%. Now this certainly doesn’t mean that oil must rally 50% in future uplegs, but bull to date this has been the mean height reached so it provides a good probability selling point. If oil is up 50%ish in a future upleg, speculators need to prepare for a correction.
Now the higher any bull market runs, the more capital it requires to boost it to a similar percentage gain as it achieved early on. For example to achieve a 100% gain on a $1 price, a stock only needs to be bid up $1 higher. But if the starting point is $10, the same 100% gain requires a price to be bid up $10 higher, or 10x as much as at the lower price. Thus as the oil bull matures we can probably expect individual upleg percentage gains to gradually trend lower.
Indeed this has occurred in this oil bull, over time individual upleg gains are fading. The first upleg off the rock-bottom $17 oil prices in late 2001 was tied for the largest at 68%. A year later a 50% upleg materialized, then another long-lived 68% specimen, and finally a smaller 55% one rolled in during 2004. But both 2005 uplegs were far more modest near 40%, at 41% and 43% respectively. Thus we should take this into account when defining high-probability-for-success shorting points for oil.
Next time oil goes up 35%+ in a major upleg, I am really going to start paying attention to psychology, looking for overbought exuberance. If it continues on to 40%+, my trailing stops will be raised as the probability of a major correction grows. And if oil spikes up high enough to achieve the average 50% gains again, I would expect the probability of a subsequent major correction to become as close to certain as one can get in the financial markets.
A similar analysis of the corrections can yield potential oil buy targets. While no one can know in advance when oil is carving exact tops or bottoms, we can certainly define whether the probability-for-success season is high or low at any particular time for oil to hit a major interim high or low. And these are the very times to trade, only when probabilities seem to be highly in our favor based on bull-to-date precedent.
The six major bull-to-date corrections noted above with the red arrows had an average loss of 21%. There is no real pattern here like there was for oil’s individual upleg gains moderating as this bull matures, so 21% is as good of correction target as any. Oil’s latest interim high was just under $70 on the day after Katrina slammed into the Gulf, so a 21% correction here would carry it down to $55ish. But so far it has only corrected 12% since August 30th.
Since oil seems to be in correction mode today, and indeed certainly ought to be after this summer’s major uplegs, it is these correction targets that really interest me right now. As this current correction matures the odds will continue to grow for a high-probability-for-success buying opportunity for both oil futures and oil-producing stocks. Since it has been about a year since the last awesome opportunity it would be great to load up on oil plays again at relative bargains.
Interestingly it is not only this average-correction metric that is calling for oil to bottom near the mid-$50s this time around. So are technicals as the two major support-and-resistance trading channels rendered in the chart above reveal.
Oil’s first major uptrend pipe ran from the birth of this bull until oil broke free from it in late 2004. But by late 2003 a new steeper uptrend pipe was already forming, defined by the Support 2 and Resistance 2 lines above. It is natural for new steeper trend channels to form as a bull gathers momentum. Over time the rising slopes of these trends form a linear parabola, a continually steepening series of upslopes that finally approach vertical at the blowoff top near the end of a secular bull.
The validity of these trends can be established by the black 200-day moving average line. When periods of a year or more are analyzed, a price’s 200dma tends to run parallel with its prevailing trend. In the first uptrend channel above this indeed was the case. And now over the past year oil’s 200dma has steepened enough to run parallel with its latest uptrend pipe. Thus we can be pretty sure these channels are important.
I am particularly interested in the lower support line of this latest channel, labeled Support 2 above. Oil corrected down to it following major runs higher a couple times in 2004. Today this line is intercepting $51 or so and it is continuously rising. If oil’s current correction takes a couple more weeks or months to mature, this support line will have risen to the mid-$50s or so, right in line with the $55 defined above based on 21% average corrections.
The markets as a whole are nothing more than the ultimate study in probabilities, and technical analysis seeks to define and quantify these probabilities. When multiple independent technical approaches point to a common target zone, the case for a price to visit this area grows much stronger. While oil can do whatever it wants, odds are it will correct down near $55 before its next major upleg erupts.
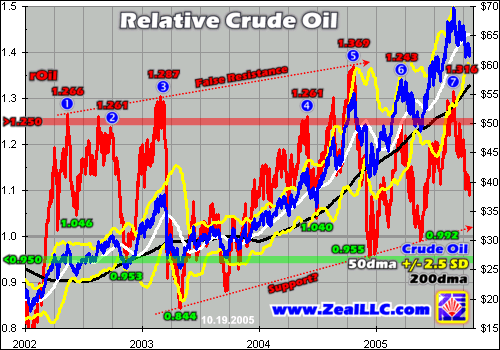
Interestingly even a third approach is pointing to a similar correction target, Relativity. If you look at the chart above, oil prices advance away from their black 200dma in uplegs and then correct back down under their 200dma in corrections. By dividing the price of oil by its own 200dma, Relative Oil or rOil expresses oil as a constant multiple of its 200dma. When charted this creates horizontal trading bands that have proven very profitable in other markets.
In oil’s case, we have been defining its relative trading range from less than 0.95x its 200dma on the long side to greater than 1.25x its 200dma on the short side. The idea for oil traders is to throw long oil when it gets under its 200dma and prepare to be stopped out and/or throw short when oil stretches more than 25% above its 200dma. Bull to date this strategy has worked quite well.
In every major top achieved by oil in this bull to date it approached or exceeded 1.25x its 200dma. The major interim tops numbered above, which correspond exactly with the numbers in the first chart, materialized at an average level of 1.286x oil’s 200dma. And as you can see on this chart, these red rOil spikes are always short-lived. Oil never seems to be able to sustain overbought levels stretched far above its 200dma. When it exceeds 1.25x, it is time to prepare for an imminent correction.
So far oil seems to correct to just under its 200dma on these periodic corrections. We’ve been using a 0.95x target, but this may need to be redefined in light of recent higher interim rOil lows. The red rOil support line rendered above shows an ascending pattern of higher rOil multiples at major oil lows over the past several years. We need to discuss two scenarios for rOil lows, one with this trend continuing and one with it not.
If the rOil lows keep marching higher, oil’s next bounce could occur as high as 1.05x its 200dma. This yields an upper-end target of $59, not far from today’s oil prices at all. But as I’ve developed this Relativity concept while actively trading other markets like gold and silver, I’ve found that non-horizontal trend lines drawn with relative data tend to be problematic. They may persist for a few relative extremes, but then they fail and the linear trend reasserts itself.
This phenomenon can even be seen in this chart. If you look at the rOil highs 1, 3, and 5 above, they seem to form an ascending resistance line, labeled False Resistance. This line could be extended so that expectations of future rOil highs were at ever-ascending levels. But the latest uplegs 6 and 7 failed far lower than this hypothetical rOil resistance line that would now be over 1.40x. By its very nature the Relativity construct favors horizontal linear trading channels rather than upslopes or downslopes.
Back to the rOil correction target for crude oil today, if we average the major rOil lows a level of 0.972x is calculated. This is just over our long-time 0.95x long-signal zone, which may be a little low. Relative long signals should be a bit inside the probable relative extremes so traders have time to act and recognize a signal being flashed. If oil again corrects to 0.95x to 0.97x its 200dma, it yields a current target of just under $54 to $55.
Thus three separate technical approaches yield a $55ish price target for crude oil in this current correction. Technically the probability that oil will trade under this number remains high, but definitely not a certainty. If oil does indeed trade down under $55 as probabilities suggest, then it will probably be a fantastic time to throw long oil again. Speculators and investors alike should carefully watch for these levels.
For speculators trading oil futures, $55ish oil ought to be a fantastic time to throw long, via long oil futures or oil call options. While major oil uplegs in the past varied in length, I think speculators ought to allow 6 to 9 months after this low for oil’s next upleg to mature and push trades way into the money. Oil’s secular bull will continue as long as demand growth exceeds supply growth worldwide, a situation that won’t be remedied any time soon, if ever.
For investors and speculators, another way to play this oil bull is via oil-producing stocks. Oil stocks have both advantages and disadvantages relative to oil futures. Oil stocks can leverage oil’s gains dramatically and yield much larger absolute profits than futures, all without risking capital on margin. Oil stocks are also far easier to trade for most people. On the downside, other factors besides oil, like the general stock markets, can also affect oil-stock prices. They are not as pure of a play as oil itself.
If oil heads back down to $55ish levels to regroup, I suspect it will be a great time to buy oil stocks, subject to one crucial caveat. Lower oil prices will spook current holders of oil stocks and spawn selling, pushing oil-stock prices lower. The best time to buy oil stocks within a secular oil bull is when oil is making one of its periodic corrections and becomes temporarily oversold and unloved.
The caveat is oil stocks, since they are increasingly held by mainstream investors, will probably be sold off if the general stock markets correct. If the stock markets start sliding more rapidly, there is a good chance mainstream investors will throw out the undervalued oil stocks with the overvalued general stocks. This could drive oil-stock prices even lower. With the high bull-to-date correlation between the oil-stock index and the S&P 500, this is a very real risk for contrarians to ponder.
So oil is correcting, with several technical indicators suggesting a $55ish interim bottom this time around, probably in the coming weeks or months. Once this correction matures, it should be a great time to throw long oil-related trades again for the first time in nearly a year. Futures guys have nothing else to worry about, but stock guys will have to temper their decisions with how the stock markets appear to be doing. Odds are oil stocks, though they will go lower with an oil correction, will bottom with the general stock markets.
At Zeal we are patiently awaiting both events. We have been researching oil stocks extensively for a year now waiting for a major buying opportunity. As the oil correction continues, and probably the stock-market correction as well, outstanding buy opportunities should emerge in elite oil stocks. We will detail our actual trading decisions in the oil-stock realm as they are made in future issues of our acclaimed monthly Zeal Intelligence newsletter.
In addition to our stock picks and trading timing, our subscribers also gain exclusive access to large charts on our website, including a larger high-resolution rOil chart updated twice a week. rOil should provide excellent clues as to when the oil bottom is in and the time to buy is at hand. Please subscribe today so you don’t miss this potentially awesome oil-stock buying opportunity in the months ahead!
The bottom line is oil, like all secular bull markets, naturally flows and ebbs. It storms ahead to new highs in major uplegs before becoming overbought. And then to bleed off excessively bullish sentiment at these interim tops healthy corrections occur periodically. Without a doubt the best time to throw long oil-related trades is at these correction-driven major interim lows.
Since oil’s latest correction appears to already be well underway, it shouldn’t be too many weeks or months until oil prices once again carve a new interim bottom. I can’t wait to see what splendid buying opportunities emerge from these lows!
Adam Hamilton, CPA October 21, 2005 Subscribe |
|||||||
|
|
|
|
|
|
|
|
|
|
|
|
|
|
|
|||