![]()
Einstein, Gold, and the Dollar
Adam Hamilton October 27, 2000 3914 Words
“Put your hand on a hot stove for a minute, and it seems like an hour. Sit with a pretty girl for an hour, and it seems like a minute. THAT’S relativity.” - Albert Einstein
Albert Einstein was one of the most amazing human beings the world has ever seen. He had an unquenchable zeal for life, an unfathomably brilliant intellect, and a wonderful sense of humor and wit. Born in 1879 in Germany, Einstein struggled with school and eventually failed an entrance exam to study electrical engineering at college. He ultimately earned admission to another university, and graduated as a teacher of mathematics and physics. Unable to find a job after school, a classmate’s father interceded on Einstein’s behalf at the Patent Office in Bern, Switzerland. Starting at the very bottom, Einstein toiled at the patent office from 1902 to 1909, only receiving his first promotion in 1906!
Isolated from much scientific literature and the community of professional scientists, this unassuming patent clerk was quietly writing essays that would forever change the world. Einstein wrote three groundbreaking papers in 1905. The second paper introduced the special theory of relativity, which Einstein later jovially explained in the opening quote above. Special relativity dealt with the question of frames of reference and perspectives and the absolute speed of light. In a nutshell, Einstein stated that the laws of physics had to be uniform regardless of frame of reference. He used a magnificent example involving moving platforms to explain his postulates.
Here is the special theory of relativity crudely paraphrased through the following example… Imagine yourself in a vacuum, shining a flashlight into the void. Photons of light are streaming out of your flashlight, traveling about 186,000 miles per second (mps). Now imagine you are in the same vacuum, but sitting in a bus traveling 70 miles per hour (mph). You now point the illuminated flashlight out of the front of the bus. Now how fast are the photons streaming out of your flashlight relative to a stationary pedestrian the bus just roared past? One would normally assume that the light would now be traveling at 186,000 mps PLUS 70 mph, that the velocity of the bus should be added to the velocity of light.
Einstein proved the fault in this assumption, however. No matter how fast you are moving, or what direction your flashlight is facing, or how fast the observer is moving, the speed of light remains a constant 186,000 mps. The point of reference does not matter, as the speed of light is inviolable and will be the same regardless of velocities and positions of the point of origin and the point of destination.
Einstein’s theory is applicable to objects moving at all speeds, including stationary objects or objects moving vastly slower than the speed of light, but the effects are miniscule and almost immeasurable. From an everyday practical perspective, relative motion and the frame of reference DO matter. For example, to survive a freeway driving experience, our amazing brains perform untold myriads of calculations each second. We constantly analyze our automobile’s speed, and our relative position to stationary objects and to other moving vehicles. The fact that heavy traffic flows relatively smoothly at high speeds is an empirical testament to the validity of our understanding and practical application of relative motion.
These perspectives become much more difficult to crunch and understand for more abstract comparisons. For instance, calculating the speed of a train moving relative to a stationary object is fairly easy. But if TWO trains are approaching each other, calculating the closing speed is more difficult, even from the same static vantage point. If the observer doing the calculations is also MOVING, in an automobile alongside the tracks, for instance, calculating the absolute velocity of the two speeding trains is greatly complicated. Add a few additional factors, such as one train accelerating and the other decelerating, while also changing the speed of the moving automobile observation point, and the problem of measuring the speed of the two trains becomes virtually impossible without resorting to highly specialized equipment.
While some of the questions we have faced on physics exams in school seemed absurdly challenging at the time, these examples pale in comparison to the ultimate real world example of moving platforms … the global financial markets. Unlike the moving train example, there are simply no stationary platforms from which to observe market action. In practice, currencies are usually used as proxies for stationary observation points… for instance, the gold price (and every other investment’s price) is measured in dollars. In reality, the currencies are a moving observation point, and their “velocity” is changing constantly, 24 hours a day. Gold is like one “moving train”, and the dollar is like the second “moving train”, and their relative motion complicates and obscures gold price movements. From the perspective of the moving dollar train, looking across the plains at the approaching gold train, it is difficult to get a true perspective on gold’s real value. In this essay, we will attempt to freeze the dollar train at a moment in time, and then try and gain a new perspective on gold price movements from a frozen stationary dollar observation point, rather than from a perpetually moving dollar platform.
Before we begin, it is useful to examine the raw data. The graph below shows the US Dollar Index, which is a measure of the dollar’s value against a basket of important currencies, and gold since 1994…
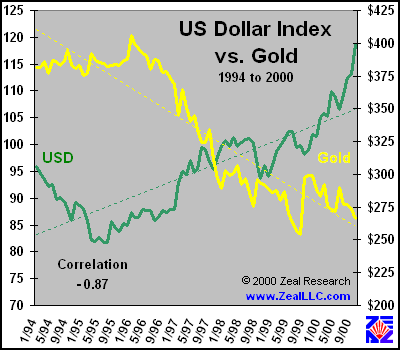
Gold investors have long known that gold has an inverse relationship to the dollar. As gold is measured in dollars, a decrease in the value of a dollar usually results in an increase in the price of an ounce of gold, and vice versa, everything else being equal.
Empirically, the monthly data set graphed above verifies this hypothesis, with a correlation of –0.87. This is very strongly negative! A correlation of –1 would indicate gold and the dollar always move exactly opposite of each other, a correlation of 0 would indicate their movements are totally unrelated, and a correlation of +1 would indicate they always move in the same direction. The strong negative correlation lends credence to the popular theory among gold investors today that the high dollar value is the key to the low gold price. The linear trends of the data series are shown as light dotted lines in the graph, and they accentuate the inverse relationship between the dollar and gold.
As shown by the green line in the graph, the dollar has recently launched a mega rally by currency standards, gaining around 21% in value since September 1999. Provocatively, that is the same month in which the NASDAQ launched its final assault on 5000. In September 1999, the NASDAQ was trading around 2750. The incredible 21% spike in the dollar index coincides exactly with the NASDAQ’s speculative bubble top blow-off. Initially, this made sense, as the roaring NASDAQ returns from September to March likely increased the international demand for dollars from foreigners scrambling to get a piece of this American market’s action. Surprisingly, the dollar has kept rising SINCE March even after the NASDAQ became a dog.
Some of this wild dollar rally is likely attributable to higher oil prices, as the international oil market is settled in dollars (although our old buddy Saddam Hussein is actively campaigning to change this at the moment!). Foreign nations have to convert increased amounts of their local currencies into US dollars to pay for more expensive oil. Selling local currencies to purchase dollars drives up dollar demand and hence dollar prices on international foreign exchange markets.
It is very interesting to note that gold has been very strong since September 1999 relative to the US dollar. With a 21% rise in the dollar, gold should have been expected to drop a similar percentage in terms of dollars. Surprisingly however, gold is trading only slightly lower than it was one year or even two years ago. Perhaps a sign of a life and strength in the slumbering yellow giant?
In order to halt our observation post for observing gold’s price movement, the perpetually moving price of the dollar, a moment in time must be chosen. The choice of when to begin this analysis IS arbitrary. We ran the analysis with multiple starting dates, however, and the conclusions remained constant and valid regardless of where the initial reference point was set. We chose January 1994 as our arbitrary starting point in the data presented in this essay for a variety of reasons. 1994 marked the last date when most believe any quasi-normalcy has existed in the world gold markets by historical standards. Strange things have been afoot in the markets since 1995.
The gold market action since 1995 is of particular interest to investors, as gold has behaved in ways that historically have been virtually impossible for the yellow metal. Since 1995, world gold demand has greatly exceeded world mined gold supply, yet curiously the price of gold has plummeted. 1995 is when most market analysts believe the gold carry trade began in earnest. The gold carry trade involved leasing gold from central banks, immediately selling the gold on world markets, and then using the proceeds to invest in US equities. In 1995, the S&P 500 leapt northward in a giant and extraordinary bubble formation. For a snapshot of the amazing S&P 500 bubble that formed in 1995, please check out our prior essay, S&P Perpetual Motion.
The Gold Anti-Trust Action Committee (GATA), led by fearless gold lionheart Bill Murphy, has a mountain of evidence pointing to 1995 as the year that the United States and British governments initially allied with large money center banks to actively depress the price of gold. The primary motivation for the suppression of the free gold market was probably an attempt to eliminate gold’s traditional role as a leading indicator of monetary inflation. In western nations, fiat currencies have grown at unprecedented rates since 1995. By keeping the price of gold low, the proverbial golden canary in the fiat coal mine could be silenced. Interestingly, the most common argument used to make the silly assertion that inflation is low in the States is, “Well, look at the gold price! If there was inflation, gold would be up.” Analysts are CONSTANTLY parroting this line on bubblevision. For a much deeper discussion on gold price manipulation and the inevitable consequences, please see our past essays Gold Shorts Doomed Part 1 and Part 2.
Because of all these odd and seemingly inexplicable events since 1995, January 1994 was chosen as a starting date for our analysis. It is relatively recent, and it is slightly before the time when so many believe the markets went haywire and lost all touch with underlying fundamental realities.
In order to “freeze” our dollar vantage point, we simply calculated the monthly change in the value of the dollar index, and applied that percentage change to gold (in the opposite direction, of course, to account for the very strong negative correlation of gold and the US dollar). For instance, using January 1994 as our base month, if the dollar dropped 1% in the next month, we calculated a 1% rise in the price of gold, also using January 1994 as the base gold month. In effect, the January 1994 gold/dollar relationship was locked into place and subsequent dollar moves were inversely projected onto gold. This methodology creates the effect of viewing gold from a static reference point in terms of the US dollar index. It is the financial equivalent of Einstein’s fixed observation point. This hypothetically valued gold is referred to as “USD valued gold” in the following graphs. Prior to looking at the next graph, please review the first graph in this essay, focusing on the green US dollar index line. If you were to cut out the US dollar index line graph, and invert it, it would match the USD valued gold (blue line) in the graph below like a well crafted skeleton key in an ancient lock. Here is the initial graph…
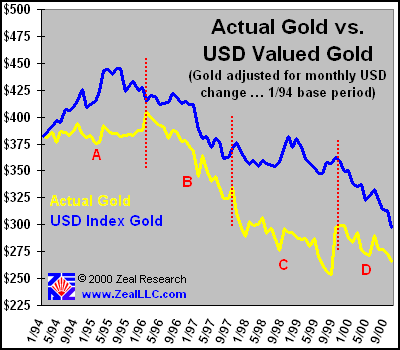
The following graph shows the size of the gap observed above, in dollars per ounce, between the actual price of gold and the expected USD value of gold using January 1994 as our vantage point…
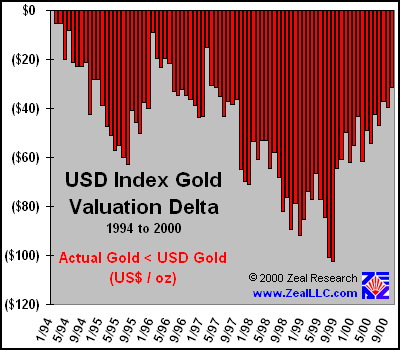
Once again, it is very interesting to note the persistent downside bias in the actual value of gold. If normal market supply and demand were solely accountable for the price of gold and the price of the dollar, why are there not at least a few months where actual gold was OVERVALUED relative to USD valued gold? There is certainly nothing “random” about the negative bias in the above graph, and any hypothesis seeking to explain the gold market action of the last five years HAS to adequately address this issue.
We will briefly examine one following graph, which superimposes the valuation delta between actual gold prices and USD valued gold which we just reviewed in the prior graph underneath of the actual price of gold since 1994…
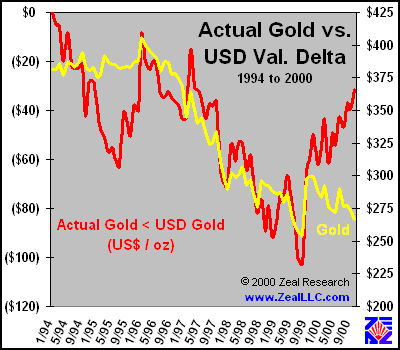
Before we discuss this graph, please note the left axis is negative, with zero at the TOP of the graph. The red line is the same information we viewed in the previous graph. As we saw in the very first graph in the essay, looking at the actual gold price relative to the USD index, gold has actually been quite strong in 2000. The negative valuation gap (shown in red in this graph, left axis, zero is up) has narrowed quite dramatically, as gold stubbornly refuses to drop much lower in response to an incredibly strong (and overvalued) US dollar. With negative sentiment surrounding gold at deliriously high levels, the fact that gold has not weakened significantly while the dollar has soared indicates there are a LOT of entities buying physical gold, and demand has likely picked up significantly in 2000 to offset the effect of a higher dollar value, which would be expected to push gold much lower, everything else being equal.
By stepping back and locking down the moving platform of the dollar, we have gained another valuable perspective on the price of gold. Although our starting point of January 1994 was arbitrary, the persistent negative bias between where gold traded and where it was expected to trade is anything but insignificant. Some fundamental non-free market force must be acting on the gold market. GATA and many private analysts have been pointing this out for years, and the evidence is continuing to accumulate at a rapid pace. Conclusions?
The analysis shows that gold IS closing the gap between where it is actually trading and where it should be trading relative to the USD index. From a gold price suppression standpoint, the maximum effect of the anti-gold campaign seems to have been exhausted between early 1998 and the Washington Agreement in late 1999. Even with gold investor morale virtually non-existent, gold is staunchly holding its own against the continuing official sector onslaught. There HAS to be dramatic demand for physical gold behind the scenes for the yellow metal to remain so strong in light of very negative sentiment and a tremendous rally in the dollar, in which gold is denominated.
Some have suggested it may be possible to slowly unwind the massive gold short (entities who owe physical gold they do not possess to creditors) positions, slowly taking the pressure off the price of gold and allowing a slow and controlled revaluation of gold to its true value. We have very strong doubts, however, that the shorts can be carefully unwound to take the system back to its original relatively un-molested state in the early 1990s. This is highly unlikely for several reasons. First, artificially low gold prices have virtually destroyed the world gold mining industry. The longer prices are artificially submerged below a true free market equilibrium point, the less near future gold production can be expected from mines to placate the creditors (mostly central banks) who originally lent out the gold. Second, major structural economic changes for the worse have occurred since the gold suppression campaign began. Oil is very expensive compared to recent years, and any backtracking will be inherently uncontrollable as traditional oil and gold price relationships exert tremendous upward pressure on the gold price. With an overvalued US dollar, US equity markets plunging deep into bear territory, a massive and unprecedented trade deficit, even a relatively small increase in the price of gold (say 20%) could lead to a major surge of gold demand, pushing the price of gold much higher. As the price of gold initially rises from purely investment demand, the mother of all short squeezes is likely to be detonated as buy orders for 10,000+ tons of short gold compete for scarce physical supply, pushing the gold price hundreds or thousands of dollars higher in mere days or weeks.
Just as Albert Einstein’s genius has stood the test of a century of scientific innovation, gold has stood the test of six millennia of human history. Gold CANNOT be driven to a value of zero by the forces arrayed against it. This has been tried before by innumerable governments throughout history, and all have failed. Like a true contrarian, Albert Einstein thought deeply on fundamental natural realities, choosing NOT to immerse himself of the hype of the day. His thoughts, untainted by what was passing as conventional scientific wisdom at the time, have forever changed the world in which we live.
The financial equivalent of the maverick scientist Einstein today are the prudent contrarians carefully pre-positioning themselves to ride the inevitable mega gold rally. They have studied history and fundamentals, and have weighed the conventional stock market hype in the balances of reality and found it wanting.
The shrinking gap between the actual gold price and the USD gold price that should have existed is sending a very clear message that is resounding through the global investment community. The officially sanctioned assault on gold is failing, and the modern day central bank gold conquistadors are being driven back by age-old and insuppressible free market forces. The only reason this has not become apparent to everyone is the incredible rally in the dollar, which has masked gold’s newfound strength and confidence. The tension on the gold spring is growing ever tighter by the day, and there is no elegant release mechanism in sight, or even possible. As sure as Einstein’s laws, there IS a point where gold cannot be driven any lower, and the nuclear energy contained in the suppressed price becomes uncontainable. At this rapidly approaching and fabled moment in time, no amount of USD upticks will suffice to further drive down the price of gold. The shackled metal will break free with a legendary fury, casting off the chains of command and control, showing its true muscle and gloriously annihilating the foes of free markets.
Adam Hamilton, CPA October 27, 2000
![]()